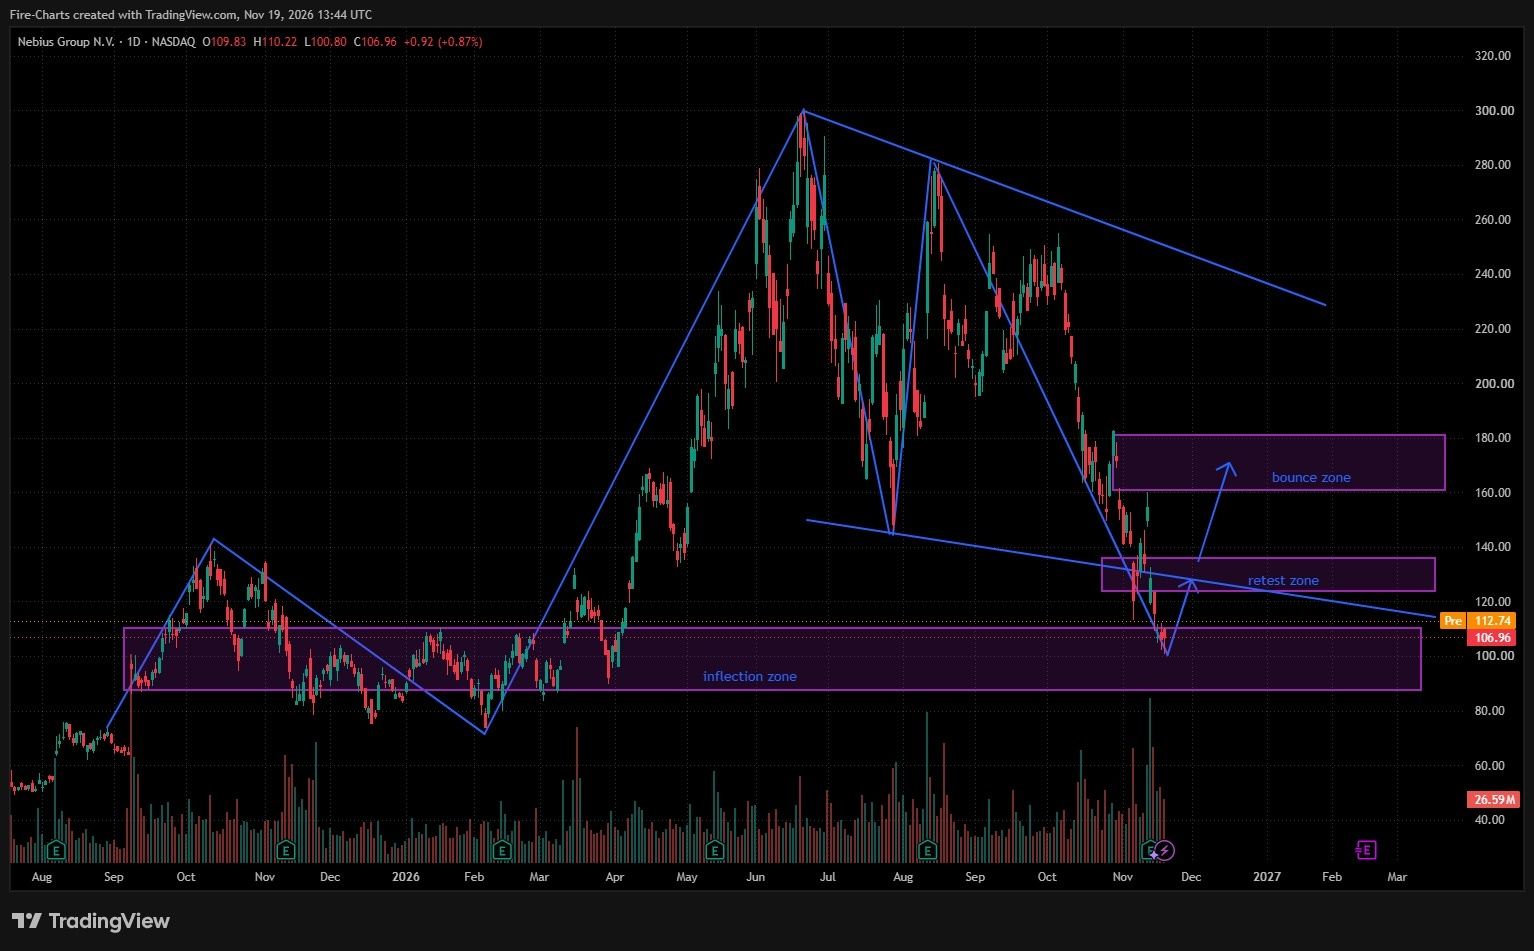

Nebius Group has shown clear signs of weakening momentum after its sharp multi-month advance peaked near the $300 area. Following the aggressive selloff from those highs, price staged several recovery attempts but repeatedly failed to sustain gains against the descending trendline resistance and key supply zones.
The latest price action raises an important question: is the current bounce simply a corrective recovery within a broader bearish structure, or can the long-term inflection zone absorb selling pressure and produce a more meaningful reversal?
My current outlook remains cautious, with the retest zone and bounce zone representing the key areas I am monitoring on the upside, while a failure to hold the inflection zone would open further downside.
1. Market Structure
NBIS experienced a powerful rally from early 2026 into mid-year, reaching approximately $300 before entering a clear correction. The subsequent decline broke previous rising structure and established a series of lower highs along a well-defined descending trendline.
Multiple attempts to reclaim higher ground have been rejected, including recent tests of intermediate resistance. Price is now interacting with the broad inflection zone (roughly the $90–$110 region) that has historically acted as a major pivot area on this timeframe.
The structure currently favors sellers as long as price remains below the descending resistance and fails to produce a higher high above the retest zone. I am watching whether the inflection zone holds or if sellers force another lower low.
2. Key Technical Levels
Historical reactions and the drawn structure highlight several important reference zones:
Bounce zone ($160–$180): Intermediate resistance and prior reaction area. A sustained reclaim here would significantly improve the bullish case.
Retest zone ($125–$140): Near-term resistance confluence with the descending trendline. This is the first major hurdle on any recovery attempt.
Inflection zone ($90–$110): Major long-term support and current battleground. Holding this zone is critical for avoiding deeper downside.
Descending trendline resistance: Connecting the mid-2026 peak with subsequent lower highs. Remains the primary structural barrier.
The confluence of the descending trendline with the retest zone makes that region particularly important. A clean daily close back above the retest zone would weaken the immediate bearish structure.
3. Trade Setup / Outlook
My primary scenario is cautious/neutral-to-bearish while price remains capped below the retest zone and descending resistance.
Key developments I am watching:
Price holds the inflection zone and begins to build a base.
A rejection from the retest zone or descending trendline that leads to another test of the lower boundary of the inflection zone.
Volume confirmation on any directional break (expansion on breakdown or reclaim).
Potential downside levels on a failure of the inflection zone would target the lower portion of that zone and potentially the $80–$90 area.
On the upside, the first meaningful target on a reclaim of the retest zone would be the bounce zone.
4. Bullish Invalidation
The cautious/bearish lean would need to be reconsidered on a sustained daily close above the retest zone and the descending trendline. A move that holds above the bounce zone would more convincingly shift the structure back toward bullish.
Until buyers demonstrate the ability to break and hold above these levels, recovery attempts are better treated as corrective.
5. Technical Outlook
Although the inflection zone has historically provided support and price is currently interacting with it, the series of lower highs and repeated rejections from descending resistance suggest sellers still hold the broader structure.
My focus remains on the inflection zone for support and the retest zone for resistance. A decisive breakdown of the inflection zone would strengthen the case for further downside, while a clean reclaim of the retest zone would open the path toward the bounce zone.
NBIS remains closely tied to AI infrastructure demand. Continued expansion of platforms such as Nvidia’s Vera Rubin across AI cloud providers (including Nebius) keeps the longer-term fundamental narrative relevant, but the technical structure currently requires patience and confirmation.
Conclusion
NBIS recent recovery attempts have encountered significant resistance, and the current structure favors a cautious approach while price remains below the retest zone and descending trendline.
The inflection zone is the key support area to monitor, while the retest zone and bounce zone represent the upside levels that would need to be reclaimed for a more constructive bias.
A confirmed breakdown below the inflection zone would strengthen the case for further downside. For now, I remain cautious about treating bounces as the start of a sustained recovery until buyers demonstrate a clear change in market structure.
This is personal technical analysis and market outlook, not financial advice. Always manage position size and risk according to your own trading plan.