🚀 Bitcoin May Be Showing an Early Bullish Signal on the 3-Day RSI! 📊
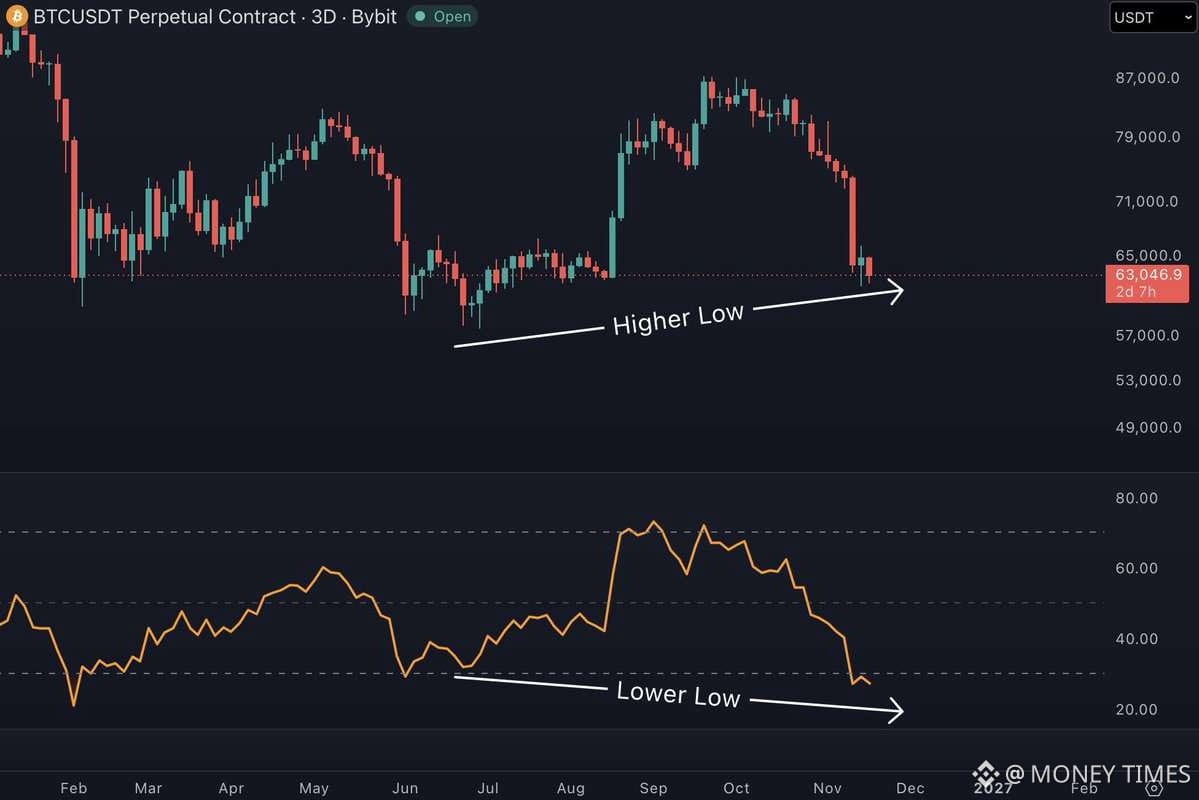
Bitcoin (BTC) could be forming a Hidden Bullish Divergence on the 3-day timeframe, a technical pattern that may signal the continuation of the broader uptrend.
Here's what the chart is suggesting:
🔹 Price Action: BTC may be forming a Higher Low.
🔹 RSI Indicator: The RSI is showing a Lower Low, creating a potential hidden bullish divergence.
🔹 Market Implication: If confirmed, this setup could indicate strengthening underlying bullish momentum and a possible continuation of the broader upward trend.
⚠️ Important: This signal is not confirmed yet. Traders should watch the current support zone and wait for a clear bullish reaction before drawing conclusions.
Bitcoin's next move could be important. Keep an eye on confirmation! 👀
$BTC
#Bitcoin #BTCRemainsUnderPressureAfterHawkishFOMCMinutes
Bitcoin (BTC) could be forming a Hidden Bullish Divergence on the 3-day timeframe, a technical pattern that may signal the continuation of the broader uptrend.
Here's what the chart is suggesting:
🔹 Price Action: BTC may be forming a Higher Low.
🔹 RSI Indicator: The RSI is showing a Lower Low, creating a potential hidden bullish divergence.
🔹 Market Implication: If confirmed, this setup could indicate strengthening underlying bullish momentum and a possible continuation of the broader upward trend.
⚠️ Important: This signal is not confirmed yet. Traders should watch the current support zone and wait for a clear bullish reaction before drawing conclusions.
Bitcoin's next move could be important. Keep an eye on confirmation! 👀
$BTC
#Bitcoin #BTCRemainsUnderPressureAfterHawkishFOMCMinutes