$POL: When the Checklist Stays on the Desk and the Excitement Takes the Car Keys
Why does $POL often feel like a sprint when the candle burns fast? The observation shows an hourly direction up and volume above baseline, a classic high‑energy scenario. Imagine a researcher who writes a checklist, then forgets it as soon as the first green bar appears – the mind races, the watchlist stays calm.
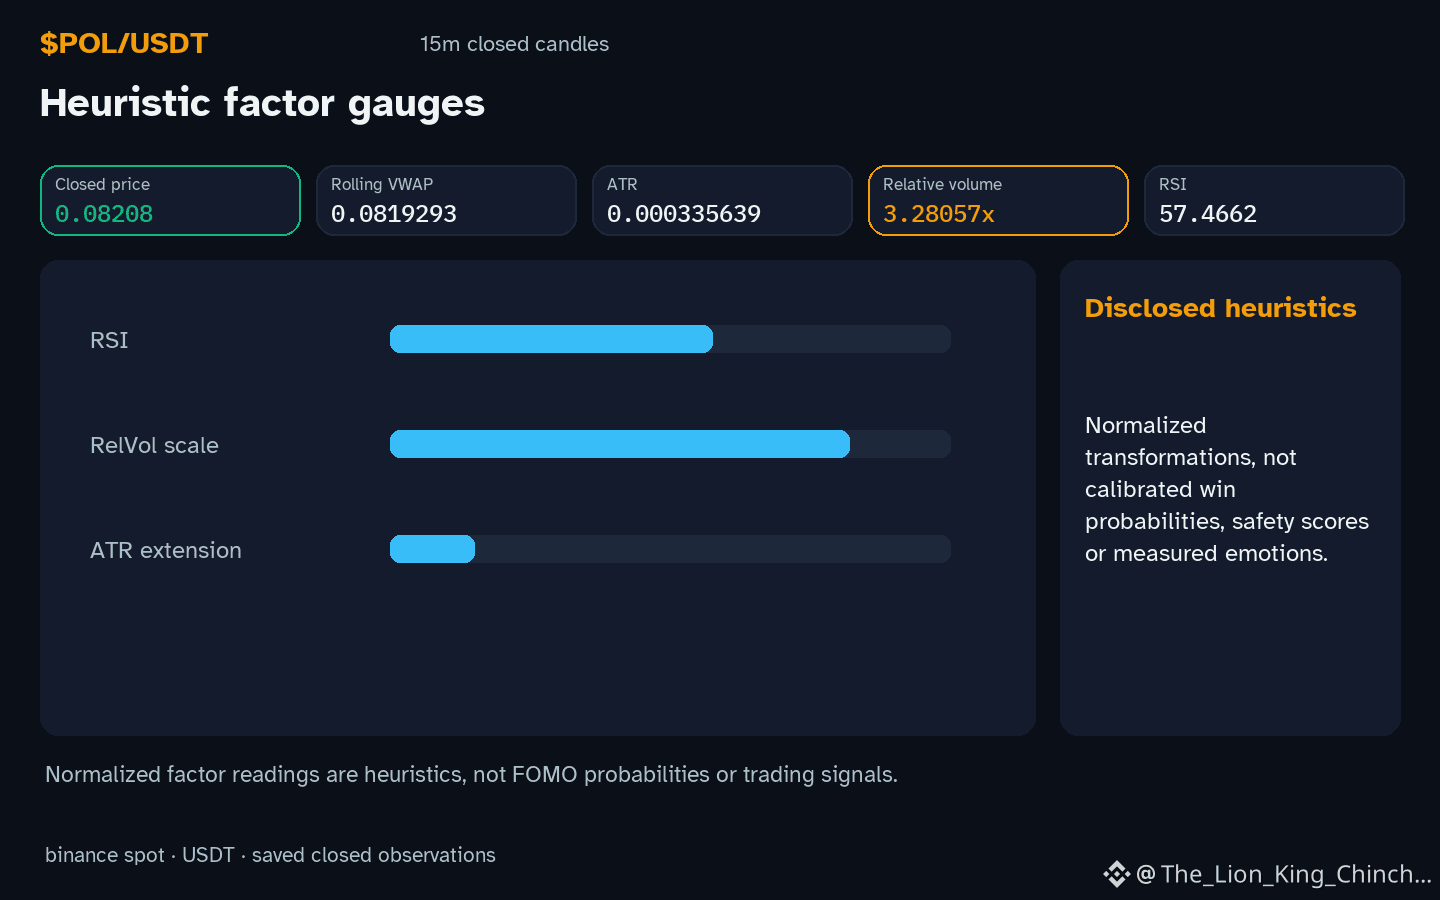
One way to guard against that rush is to treat the rapid candle as a hypothesis test. The fast move suggests momentum, but the relative volume 3.28x baseline reminds us that sheer activity can be misleading. A simple mechanism: pause after the candle closes, compare the price to the local support 0.0813 and resistance 0.08223 levels, and note the RSI 57.5. If RSI is still in a neutral band, the move may lack conviction.
A counterexample appears when the same setup repeats with a lower volume spike; the momentum fades and price reverts toward the support zone. The self‑check is straightforward: after a fast candle, wait one more hourly bar and see if price respects the earlier support or breaks it. If the next bar closes below 0.0813, the initial excitement was likely premature, and the checklist should be revisited.
Probabilistic market research, not a recommendation or guaranteed return.
For a wider view: $BTC has hourly direction down and volume above its baseline; $ZKC has hourly direction down and volume not above its baseline. This alone does not establish correlation.
#POL #BTC #ZKC #LearnCrypto
Why does $POL often feel like a sprint when the candle burns fast? The observation shows an hourly direction up and volume above baseline, a classic high‑energy scenario. Imagine a researcher who writes a checklist, then forgets it as soon as the first green bar appears – the mind races, the watchlist stays calm.
One way to guard against that rush is to treat the rapid candle as a hypothesis test. The fast move suggests momentum, but the relative volume 3.28x baseline reminds us that sheer activity can be misleading. A simple mechanism: pause after the candle closes, compare the price to the local support 0.0813 and resistance 0.08223 levels, and note the RSI 57.5. If RSI is still in a neutral band, the move may lack conviction.
A counterexample appears when the same setup repeats with a lower volume spike; the momentum fades and price reverts toward the support zone. The self‑check is straightforward: after a fast candle, wait one more hourly bar and see if price respects the earlier support or breaks it. If the next bar closes below 0.0813, the initial excitement was likely premature, and the checklist should be revisited.
Probabilistic market research, not a recommendation or guaranteed return.
For a wider view: $BTC has hourly direction down and volume above its baseline; $ZKC has hourly direction down and volume not above its baseline. This alone does not establish correlation.
#POL #BTC #ZKC #LearnCrypto