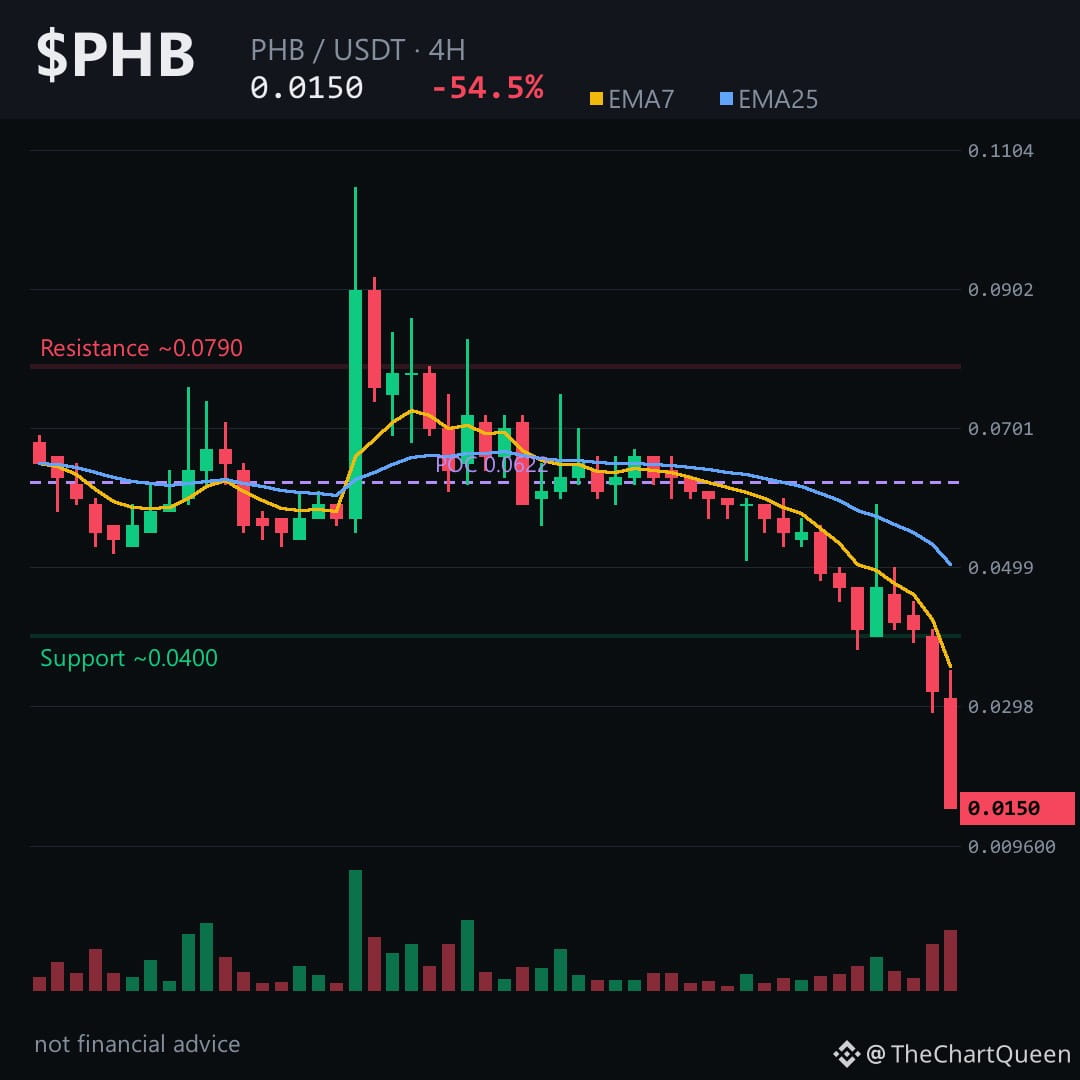
-54.55% in 24 hours.
That’s not a dip. That’s a structural break — and the chart is still printing lower lows on every timeframe.
The 4H tells the story: nine red candles out of twelve, the last closing at the low of the day. RSI at 20.44 — oversold, but in a falling market that just means sellers aren’t done. EMA structure is inverted, textbook bearish alignment.
Heaviest volume traded near 0.062, so most recent activity is now underwater. That overhead supply will likely act as resistance on any bounce.
Current price hovers around 0.015. If $PHB can’t reclaim roughly 0.0158 on a closing basis, the path of least resistance points toward 0.0137. Lose that, and the macro chart suggests air down toward 0.0095.
My read: a falling knife with no confirmed floor. The invalidation is clear — a 4H close back above 0.0158 would signal the immediate bearish momentum is fading. Until then, bounces are suspect, not strength.
Tap $PHB to pull up the chart and check these levels yourself. I’ll update my read as price reacts to the 0.0137 zone — follow so you don’t miss that breakdown analysis.
What level are you watching on $PHB right now? 👇
⚠️ Not financial advice. DYOR.
#PHB #Crypto #BinanceSquare
That’s not a dip. That’s a structural break — and the chart is still printing lower lows on every timeframe.
The 4H tells the story: nine red candles out of twelve, the last closing at the low of the day. RSI at 20.44 — oversold, but in a falling market that just means sellers aren’t done. EMA structure is inverted, textbook bearish alignment.
Heaviest volume traded near 0.062, so most recent activity is now underwater. That overhead supply will likely act as resistance on any bounce.
Current price hovers around 0.015. If $PHB can’t reclaim roughly 0.0158 on a closing basis, the path of least resistance points toward 0.0137. Lose that, and the macro chart suggests air down toward 0.0095.
My read: a falling knife with no confirmed floor. The invalidation is clear — a 4H close back above 0.0158 would signal the immediate bearish momentum is fading. Until then, bounces are suspect, not strength.
Tap $PHB to pull up the chart and check these levels yourself. I’ll update my read as price reacts to the 0.0137 zone — follow so you don’t miss that breakdown analysis.
What level are you watching on $PHB right now? 👇
⚠️ Not financial advice. DYOR.
#PHB #Crypto #BinanceSquare