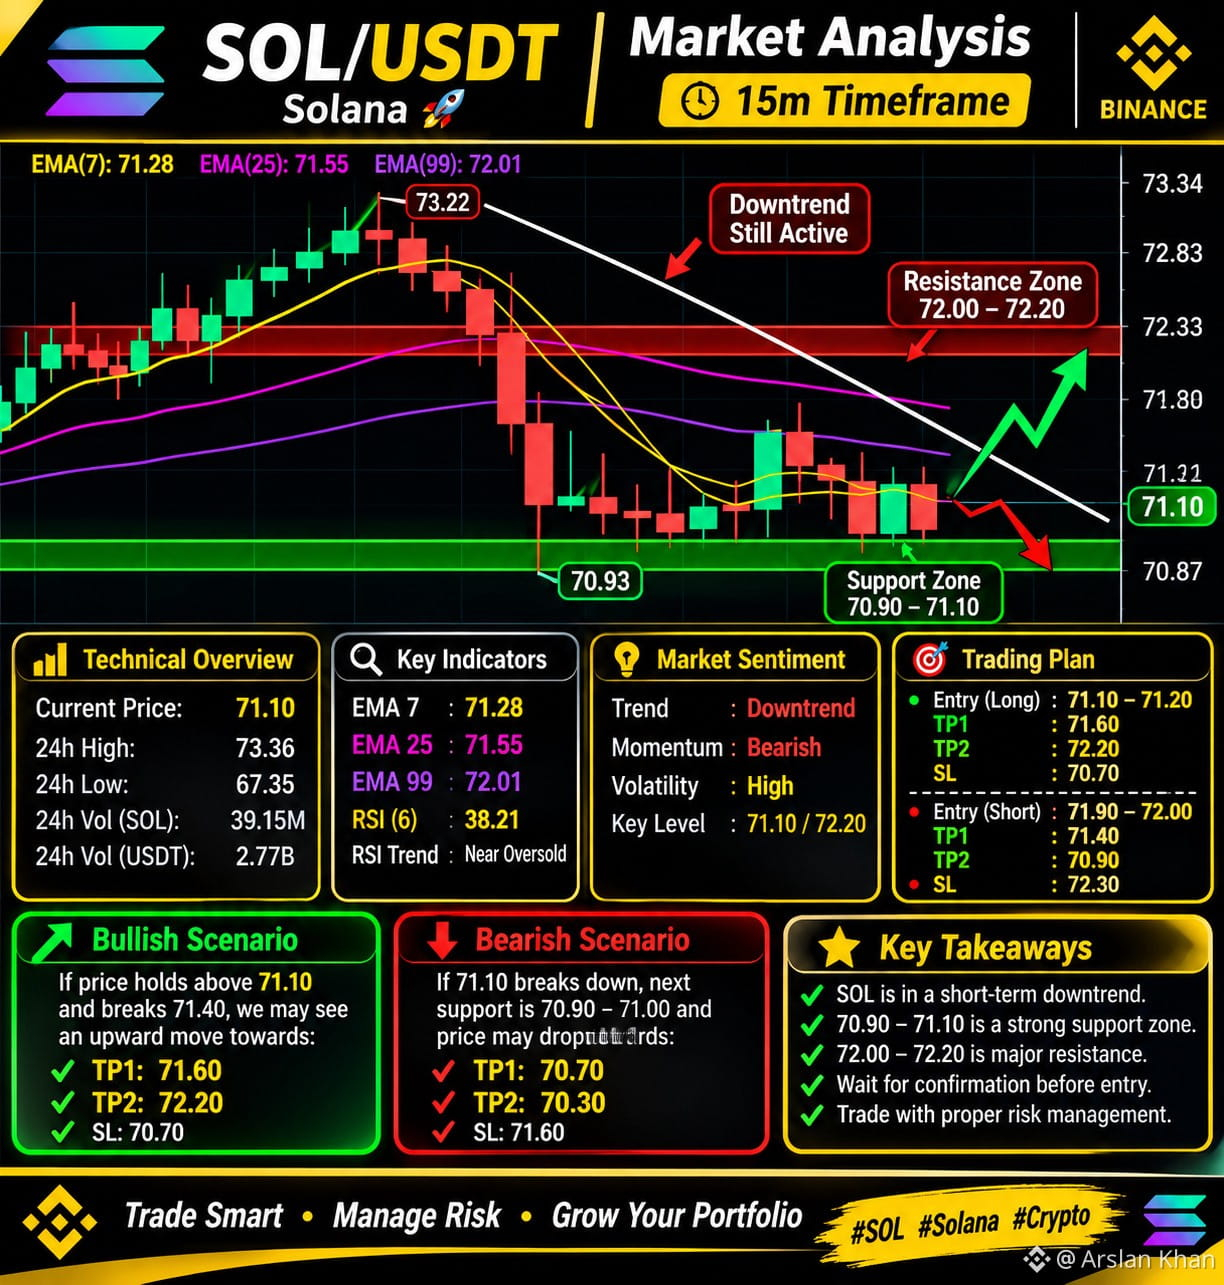
🚨 SOL/USDT – Detailed Technical Analysis | 15M Timeframe
📊 Current Market Overview
- Current Price: $71.10
- 24H High: $73.36
- 24H Low: $67.35
- 24H Change: -3.07%
🔍 Technical Analysis
SOL is currently showing short-term bearish momentum. The price is trading below all three major EMAs:
- EMA 7: $71.28
- EMA 25: $71.55
- EMA 99: $72.01
- RSI (6): 38.21
This indicates that sellers currently have the advantage. RSI is showing weak momentum, but a reversal confirmation is still needed.
🟢 Important Support Levels
- $71.10 – Immediate support
- $70.93 – Recent local low
- $70.70 – Next downside level
- $70.30 – Further bearish target
🔴 Important Resistance Levels
- $71.40 – First recovery level
- $71.55 – EMA 25 resistance
- $72.00 – $72.20 – Major resistance zone
- $72.83 – Higher resistance
📈 Bullish Scenario
If SOL holds above $71.10 and successfully breaks $71.40 with strong buying volume, a recovery towards these levels may become possible:
🎯 TP1: $71.60
🎯 TP2: $71.80
🎯 TP3: $72.20
📉 Bearish Scenario
If SOL loses the $71.10 support with a strong 15M candle close below it, further downside could follow.
🎯 TP1: $70.70
🎯 TP2: $70.30
⚠️ My Final Market View
The short-term trend remains bearish. Buyers need to reclaim $71.40 and overcome the EMA resistance before a stronger bullish recovery can be considered.
Don't rush into LONG or SHORT positions. Wait for candle confirmation, volume confirmation and proper risk management.
💡 Trade Smart. Stay Patient. Protect Your Capital.
What is your view on SOL?
Are we going to see a recovery or another downside move?
$SOL
$BTC
#Solana #CryptoAnalysis #BinanceSquare #TradFiForBeginners #CryptoSelloffTriggersMultipleWhaleLiquidations
📊 Current Market Overview
- Current Price: $71.10
- 24H High: $73.36
- 24H Low: $67.35
- 24H Change: -3.07%
🔍 Technical Analysis
SOL is currently showing short-term bearish momentum. The price is trading below all three major EMAs:
- EMA 7: $71.28
- EMA 25: $71.55
- EMA 99: $72.01
- RSI (6): 38.21
This indicates that sellers currently have the advantage. RSI is showing weak momentum, but a reversal confirmation is still needed.
🟢 Important Support Levels
- $71.10 – Immediate support
- $70.93 – Recent local low
- $70.70 – Next downside level
- $70.30 – Further bearish target
🔴 Important Resistance Levels
- $71.40 – First recovery level
- $71.55 – EMA 25 resistance
- $72.00 – $72.20 – Major resistance zone
- $72.83 – Higher resistance
📈 Bullish Scenario
If SOL holds above $71.10 and successfully breaks $71.40 with strong buying volume, a recovery towards these levels may become possible:
🎯 TP1: $71.60
🎯 TP2: $71.80
🎯 TP3: $72.20
📉 Bearish Scenario
If SOL loses the $71.10 support with a strong 15M candle close below it, further downside could follow.
🎯 TP1: $70.70
🎯 TP2: $70.30
⚠️ My Final Market View
The short-term trend remains bearish. Buyers need to reclaim $71.40 and overcome the EMA resistance before a stronger bullish recovery can be considered.
Don't rush into LONG or SHORT positions. Wait for candle confirmation, volume confirmation and proper risk management.
💡 Trade Smart. Stay Patient. Protect Your Capital.
What is your view on SOL?
Are we going to see a recovery or another downside move?
$SOL
$BTC
#Solana #CryptoAnalysis #BinanceSquare #TradFiForBeginners #CryptoSelloffTriggersMultipleWhaleLiquidations