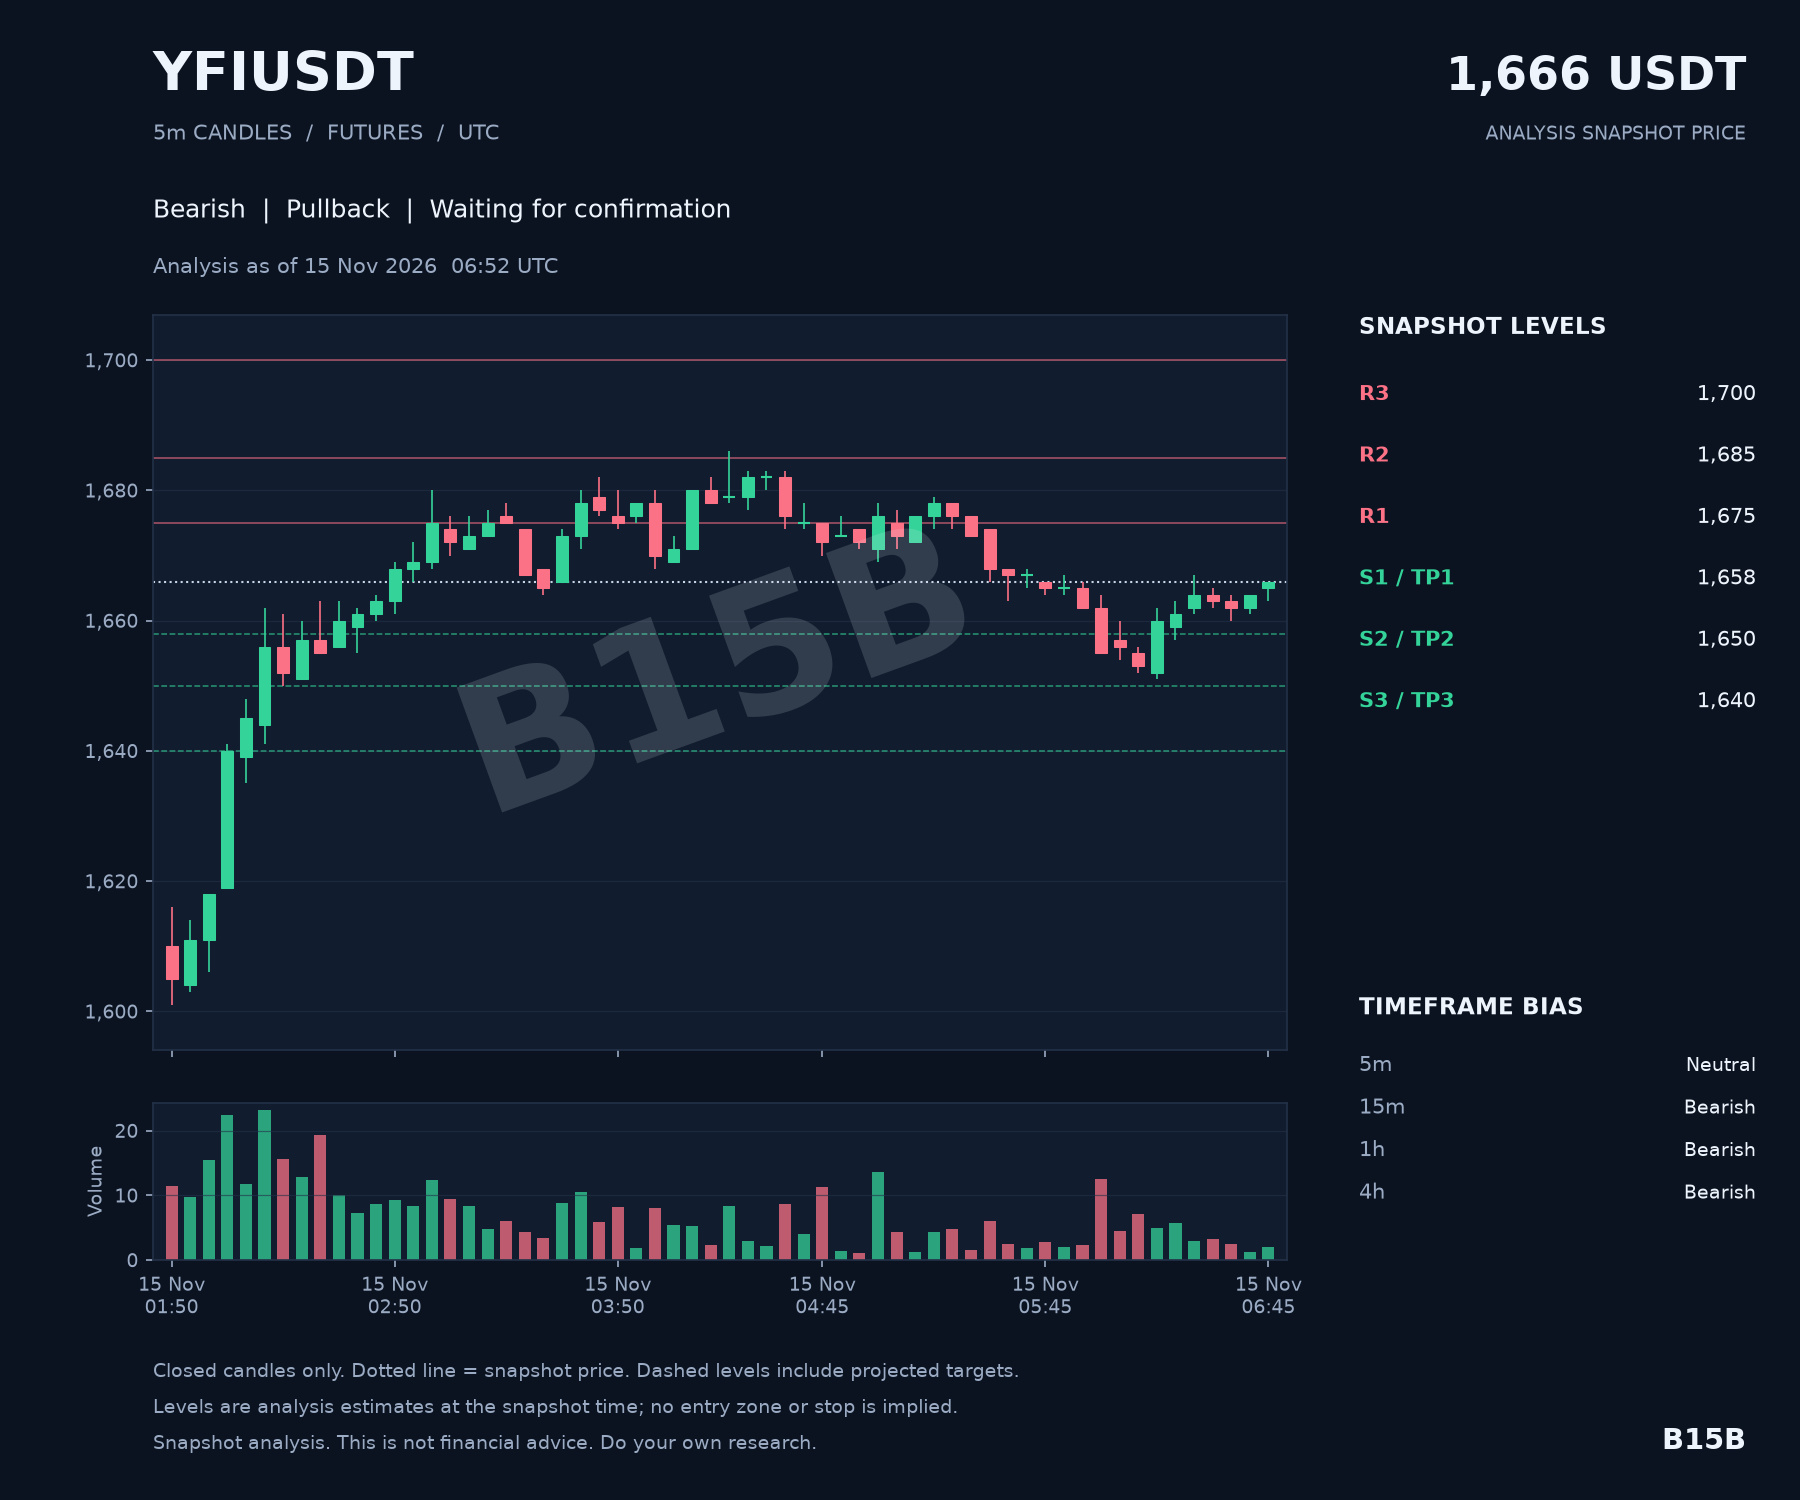
$YFI is showing significant weight right now. Looking at the charts, the trend is consistently bearish across the 15-minute, 1-hour, and 4-hour timeframes, with only the 5-minute window managing to hold a neutral stance for the moment.
The current setup looks like a pullback within that broader downtrend. At 1,666 USDT, the price is feeling the pressure, and with resistance overhead at 1,675 and 1,685, the path of least resistance appears to be toward the downside.
While we are still waiting for a confirmed entry trigger, the scenario targets are clear if the bearish momentum continues. Watch for moves toward 1,658, 1,650, and potentially 1,640. It will be interesting to see if these support levels can hold or if the trend simply carries $YFI further south.
The current setup looks like a pullback within that broader downtrend. At 1,666 USDT, the price is feeling the pressure, and with resistance overhead at 1,675 and 1,685, the path of least resistance appears to be toward the downside.
While we are still waiting for a confirmed entry trigger, the scenario targets are clear if the bearish momentum continues. Watch for moves toward 1,658, 1,650, and potentially 1,640. It will be interesting to see if these support levels can hold or if the trend simply carries $YFI further south.