Bitcoin: An Impulsive Decline, and What Needs to Happen Next
Bitcoin has sold off hard from the $87k high, and the structure of this move tells us more than the size of it.
What I am seeing
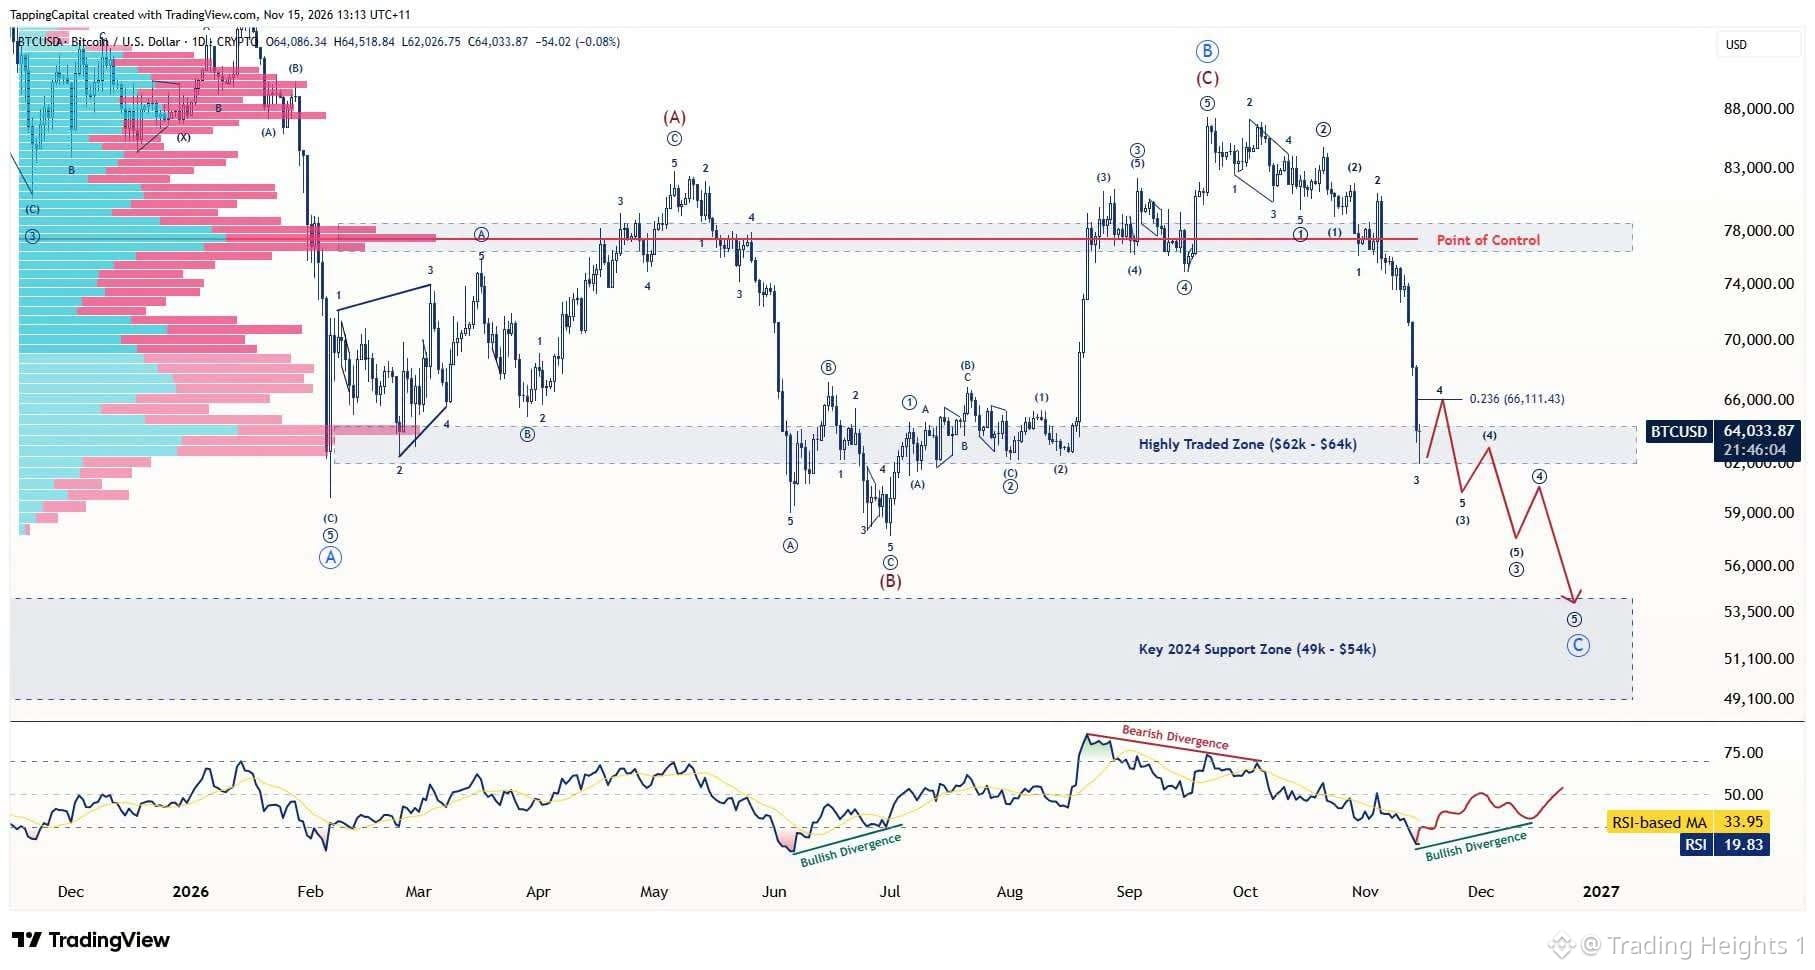
The decline looks impulsive. It started with a series of Wave 1 and Wave 2 pairs off the $87k high, then delivered a direct Wave 3 from $81k down to $62k.
That drop landed in the $62k to $64k zone, which is the most heavily traded level on the chart and a key area of support.
What the count needs from here
If this count is correct, the multiple 1s and 2s that started the move need to be balanced by multiple 4s and 5s to finish it.
In practice, that means a sequence of bounces (Wave 4s), each followed by a lower low (Wave 5s). There are three potential Wave 4s to work through before the larger structure is complete. On my chart, that path points toward the key 2024 support zone between $49k and $54k.
Daily RSI: a relief bounce is due
The Daily RSI dropped below 20 and looks to have bottomed. From here I would expect a short term relief bounce, which would make up the first of those three potential Wave 4s.
What we want to see next is bullish divergence forming, similar to what we saw in June. That means price making a series of lower lows while the RSI makes higher lows. It is a sign that selling momentum is fading even as price keeps falling.
Weekly RSI: more work to do
The Weekly RSI has only dropped to 38. That is well short of the February low of 27 and the June low of 32.
My expectation here is the same as on the Daily. I would look for lower lows in price while the Weekly RSI makes higher lows, giving us bullish divergence on the higher timeframe as well.
The short version
1. The decline from $87k looks impulsive, with Wave 3 running from $81k to $62k
2. Price is sitting in the most traded zone on the chart at $62k to $64k
3. A relief bounce from here would be the first of three potential Wave 4s
$BTC #BTC Price Analysis#
Bitcoin has sold off hard from the $87k high, and the structure of this move tells us more than the size of it.
What I am seeing
The decline looks impulsive. It started with a series of Wave 1 and Wave 2 pairs off the $87k high, then delivered a direct Wave 3 from $81k down to $62k.
That drop landed in the $62k to $64k zone, which is the most heavily traded level on the chart and a key area of support.
What the count needs from here
If this count is correct, the multiple 1s and 2s that started the move need to be balanced by multiple 4s and 5s to finish it.
In practice, that means a sequence of bounces (Wave 4s), each followed by a lower low (Wave 5s). There are three potential Wave 4s to work through before the larger structure is complete. On my chart, that path points toward the key 2024 support zone between $49k and $54k.
Daily RSI: a relief bounce is due
The Daily RSI dropped below 20 and looks to have bottomed. From here I would expect a short term relief bounce, which would make up the first of those three potential Wave 4s.
What we want to see next is bullish divergence forming, similar to what we saw in June. That means price making a series of lower lows while the RSI makes higher lows. It is a sign that selling momentum is fading even as price keeps falling.
Weekly RSI: more work to do
The Weekly RSI has only dropped to 38. That is well short of the February low of 27 and the June low of 32.
My expectation here is the same as on the Daily. I would look for lower lows in price while the Weekly RSI makes higher lows, giving us bullish divergence on the higher timeframe as well.
The short version
1. The decline from $87k looks impulsive, with Wave 3 running from $81k to $62k
2. Price is sitting in the most traded zone on the chart at $62k to $64k
3. A relief bounce from here would be the first of three potential Wave 4s
$BTC #BTC Price Analysis#