
SAND/USDT Price Analysis: Sellers Take Control as The Sandbox Faces Strong Bearish Pressure
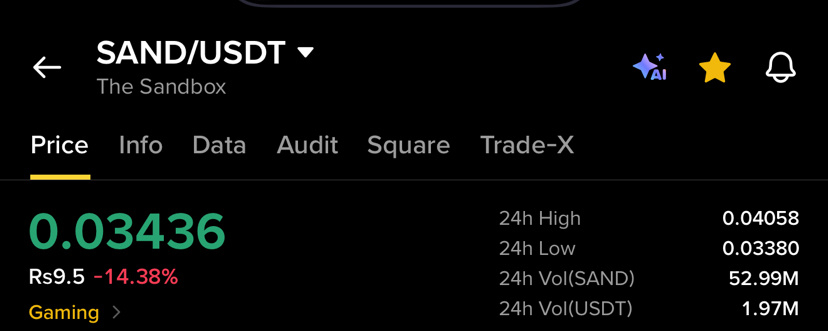
The Sandbox (SAND) is currently experiencing significant selling pressure, with its price trading around $0.03436. The latest market movement shows a clear bearish structure, raising important questions about whether buyers can regain control or whether the downward momentum will continue.
Market Overview
SAND is currently down approximately 14.38% over the last 24 hours. The price has declined from higher levels and is now trading close to its recent 24-hour low of $0.03380.
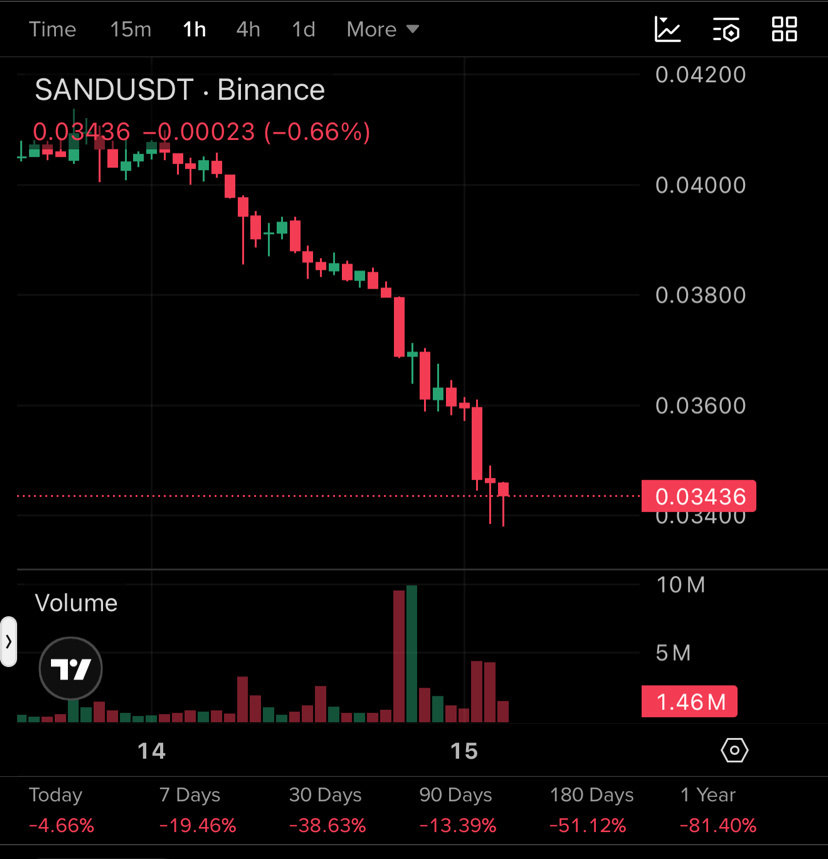
Looking at the 1-hour chart, the market structure clearly reflects weakness. Multiple consecutive red candles indicate that sellers have maintained control throughout the recent trading sessions.
Technical Analysis: Bearish Momentum Continues
One of the most noticeable features of the current chart is the series of lower highs and lower lows. This structure suggests that buying strength has not yet been sufficient to reverse the ongoing decline.
Trading volume has also increased during several major downward moves. This indicates strong market participation during the sell-off and highlights the intensity of the current bearish pressure.
At the moment, SAND is trading near the $0.03400 area, which is an important short-term level to monitor.
Key Support and Resistance Levels
Support Levels:
$0.03380 – Immediate support and recent 24-hour low.
$0.03300 – Potential next downside area if selling pressure continues.
$0.03200 – Another important level to watch during further weakness.
Resistance Levels:
$0.03500 – Immediate recovery level.
$0.03600 – Important short-term resistance.
$0.03800 – A stronger recovery zone.
What Should Traders Watch Next?
The next few 1-hour candles could provide important clues about SAND’s direction.
If buyers manage to defend the $0.03380 support area and bring stronger buying volume into the market, a short-term recovery toward $0.03500 and $0.03600 could become possible.
However, if the price breaks below $0.03380 with continued selling volume, bearish momentum could strengthen further.
A meaningful recovery would require more than a single green candle. Buyers need to demonstrate consistent strength and reclaim important resistance levels.
Final Thoughts
The current SAND/USDT chart reflects a market under considerable bearish pressure. Sellers are dominating the short-term structure, while buyers are still searching for a convincing opportunity to regain control.
The most important levels to watch are $0.03380 on the downside and $0.03500–$0.03600 on the upside.
Can SAND recover from this decline, or are we about to see another leg down?
Share your thoughts in the comments. Are you watching for a recovery or expecting further downside? Let’s discuss the next possible move of SAND!
#sand #SANDusdt #TheSandbox #CryptoAnalysis #CryptoMarket
$SAND