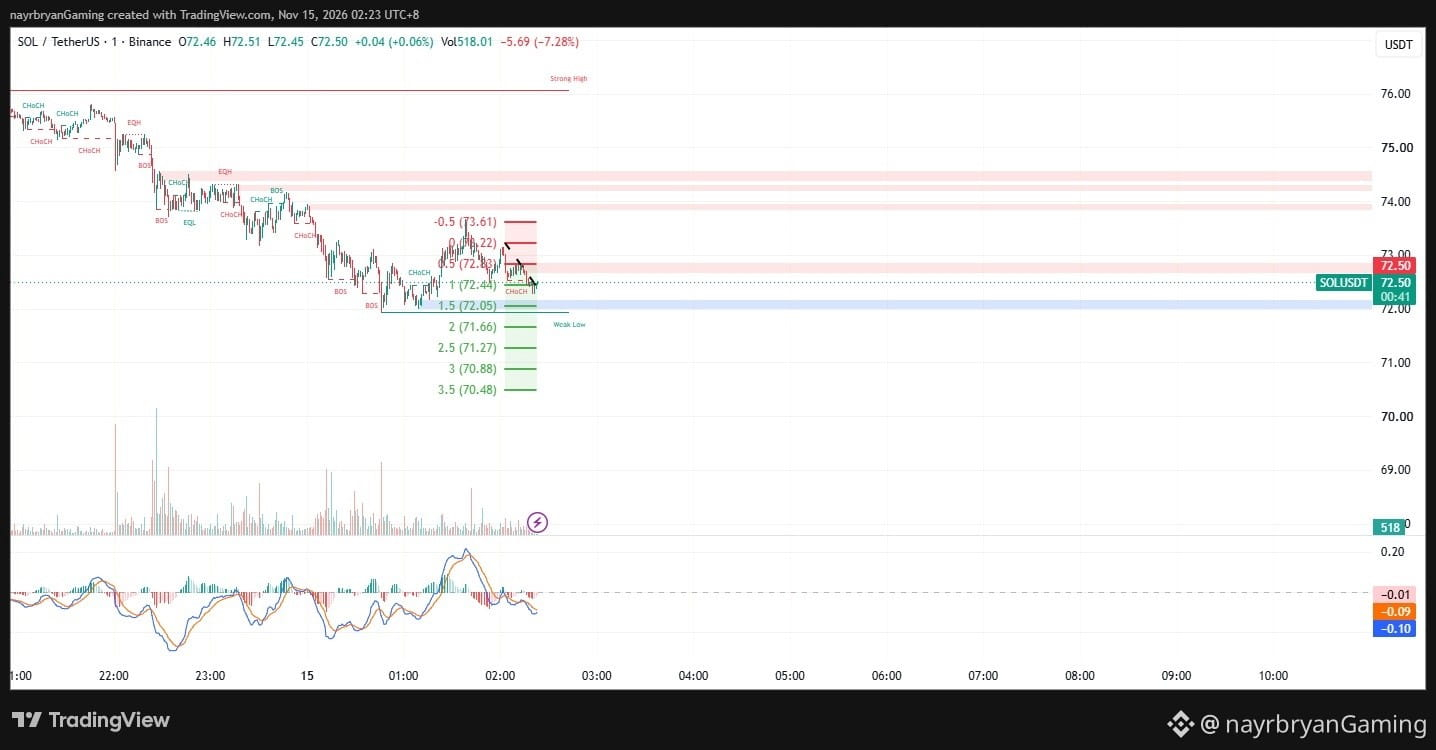
LIGHT ANALYSIS / CHART SETUP — SOL/USDT
📈 STRUCTURE OVERVIEW
Market Phase:
Downtrend → Temporary Recovery → Resistance Test
Current Price:
72.50
Immediate Resistance:
72.70–72.83
Upper Resistance:
73.22
Major Resistance:
73.61
Support Reference:
72.44
Lower Support:
72.05–71.66
Extended Downside:
71.27 → 70.88 → 70.48
---
📌 WHAT I'M WATCHING
SCENARIO A — BEARISH CONTINUATION
If SOL loses the 72.44 reference and confirms a breakdown below 72.05, price could rotate toward:
71.66 → 71.27 → 70.88 → 70.48.
Watch for selling pressure and volume confirmation around the support zones.
SCENARIO B — BULLISH RECOVERY
If SOL reclaims 72.83 and establishes stronger price acceptance above this level, the immediate bearish pressure could weaken.
The next important resistance references are:
73.22 → 73.61.
A recovery needs confirmation rather than an assumption based on a few green candles.
---
📊 INDICATOR CHECK
MACD:
Approximately -0.10 / -0.09.
Histogram:
Approximately -0.01.
Price Structure:
Broader bearish structure.
Current Price:
72.50.
Important Support:
72.05–71.66.
Bullish Recovery Confirmation:
Reclaim above 72.83.
---
📝 CHART NOTE
SOL remains in a broader bearish structure despite its recent recovery attempts.
The 72.44–72.05 region is important for monitoring the next reaction.
A confirmed breakdown could expose lower Fibonacci extensions, while a sustained reclaim of resistance could create room for a short-term recovery.
Patience and confirmation remain essential.
This is an educational chart framework, not a trade recommendation.
— @nayrbryanGaming
#SOLAnalysis #ChartSetup #PriceAction #SmartMoney #Fibonacci #CryptoTrading #TechnicalAnalysis #DYOR #NFA
📈 STRUCTURE OVERVIEW
Market Phase:
Downtrend → Temporary Recovery → Resistance Test
Current Price:
72.50
Immediate Resistance:
72.70–72.83
Upper Resistance:
73.22
Major Resistance:
73.61
Support Reference:
72.44
Lower Support:
72.05–71.66
Extended Downside:
71.27 → 70.88 → 70.48
---
📌 WHAT I'M WATCHING
SCENARIO A — BEARISH CONTINUATION
If SOL loses the 72.44 reference and confirms a breakdown below 72.05, price could rotate toward:
71.66 → 71.27 → 70.88 → 70.48.
Watch for selling pressure and volume confirmation around the support zones.
SCENARIO B — BULLISH RECOVERY
If SOL reclaims 72.83 and establishes stronger price acceptance above this level, the immediate bearish pressure could weaken.
The next important resistance references are:
73.22 → 73.61.
A recovery needs confirmation rather than an assumption based on a few green candles.
---
📊 INDICATOR CHECK
MACD:
Approximately -0.10 / -0.09.
Histogram:
Approximately -0.01.
Price Structure:
Broader bearish structure.
Current Price:
72.50.
Important Support:
72.05–71.66.
Bullish Recovery Confirmation:
Reclaim above 72.83.
---
📝 CHART NOTE
SOL remains in a broader bearish structure despite its recent recovery attempts.
The 72.44–72.05 region is important for monitoring the next reaction.
A confirmed breakdown could expose lower Fibonacci extensions, while a sustained reclaim of resistance could create room for a short-term recovery.
Patience and confirmation remain essential.
This is an educational chart framework, not a trade recommendation.
— @nayrbryanGaming
#SOLAnalysis #ChartSetup #PriceAction #SmartMoney #Fibonacci #CryptoTrading #TechnicalAnalysis #DYOR #NFA