BNB is sitting right at the bottom of its swing — is this where sellers finally lose control?
$BNB is trading under a bearish stack on the 4h and 1h, with price below EMA50 below EMA200, so the swing trend is still down and the call stays SHORT.
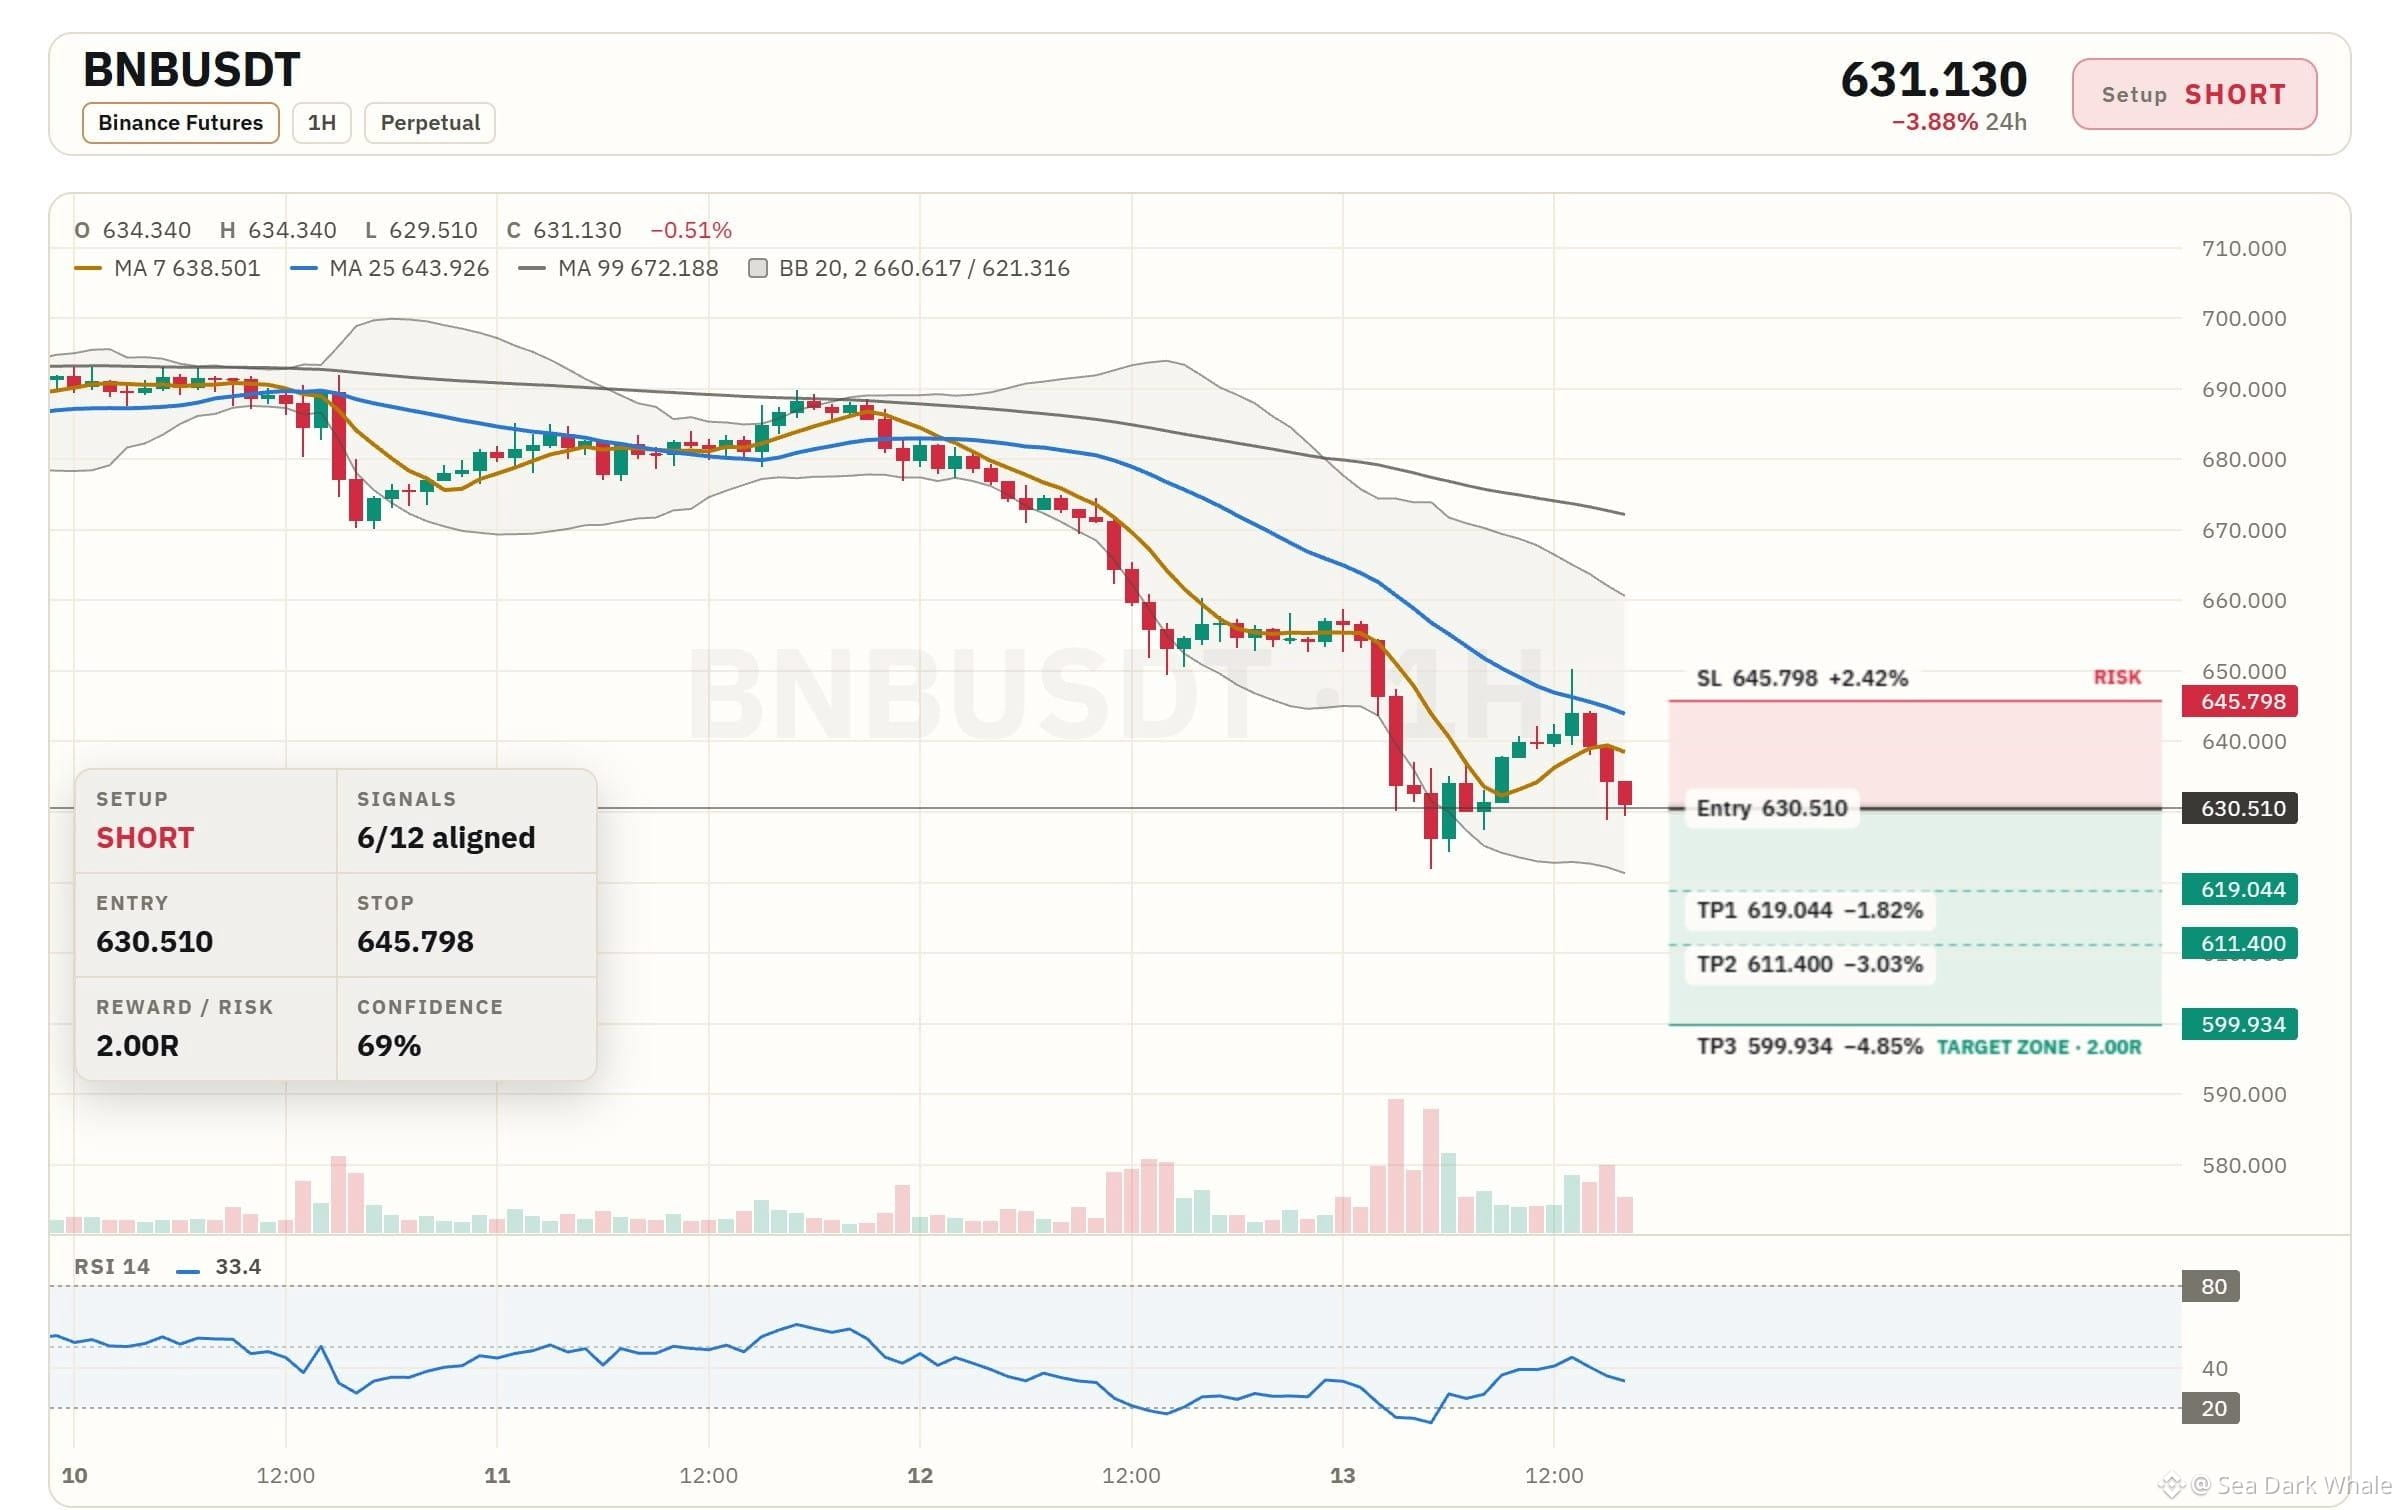
Entry: 629.677 – 631.343
TP1: 619.044 (-1.8%)
TP2: 611.400 (-3.0%)
TP3: 599.934 (-4.8%)
SL: 645.798 (+2.4%)
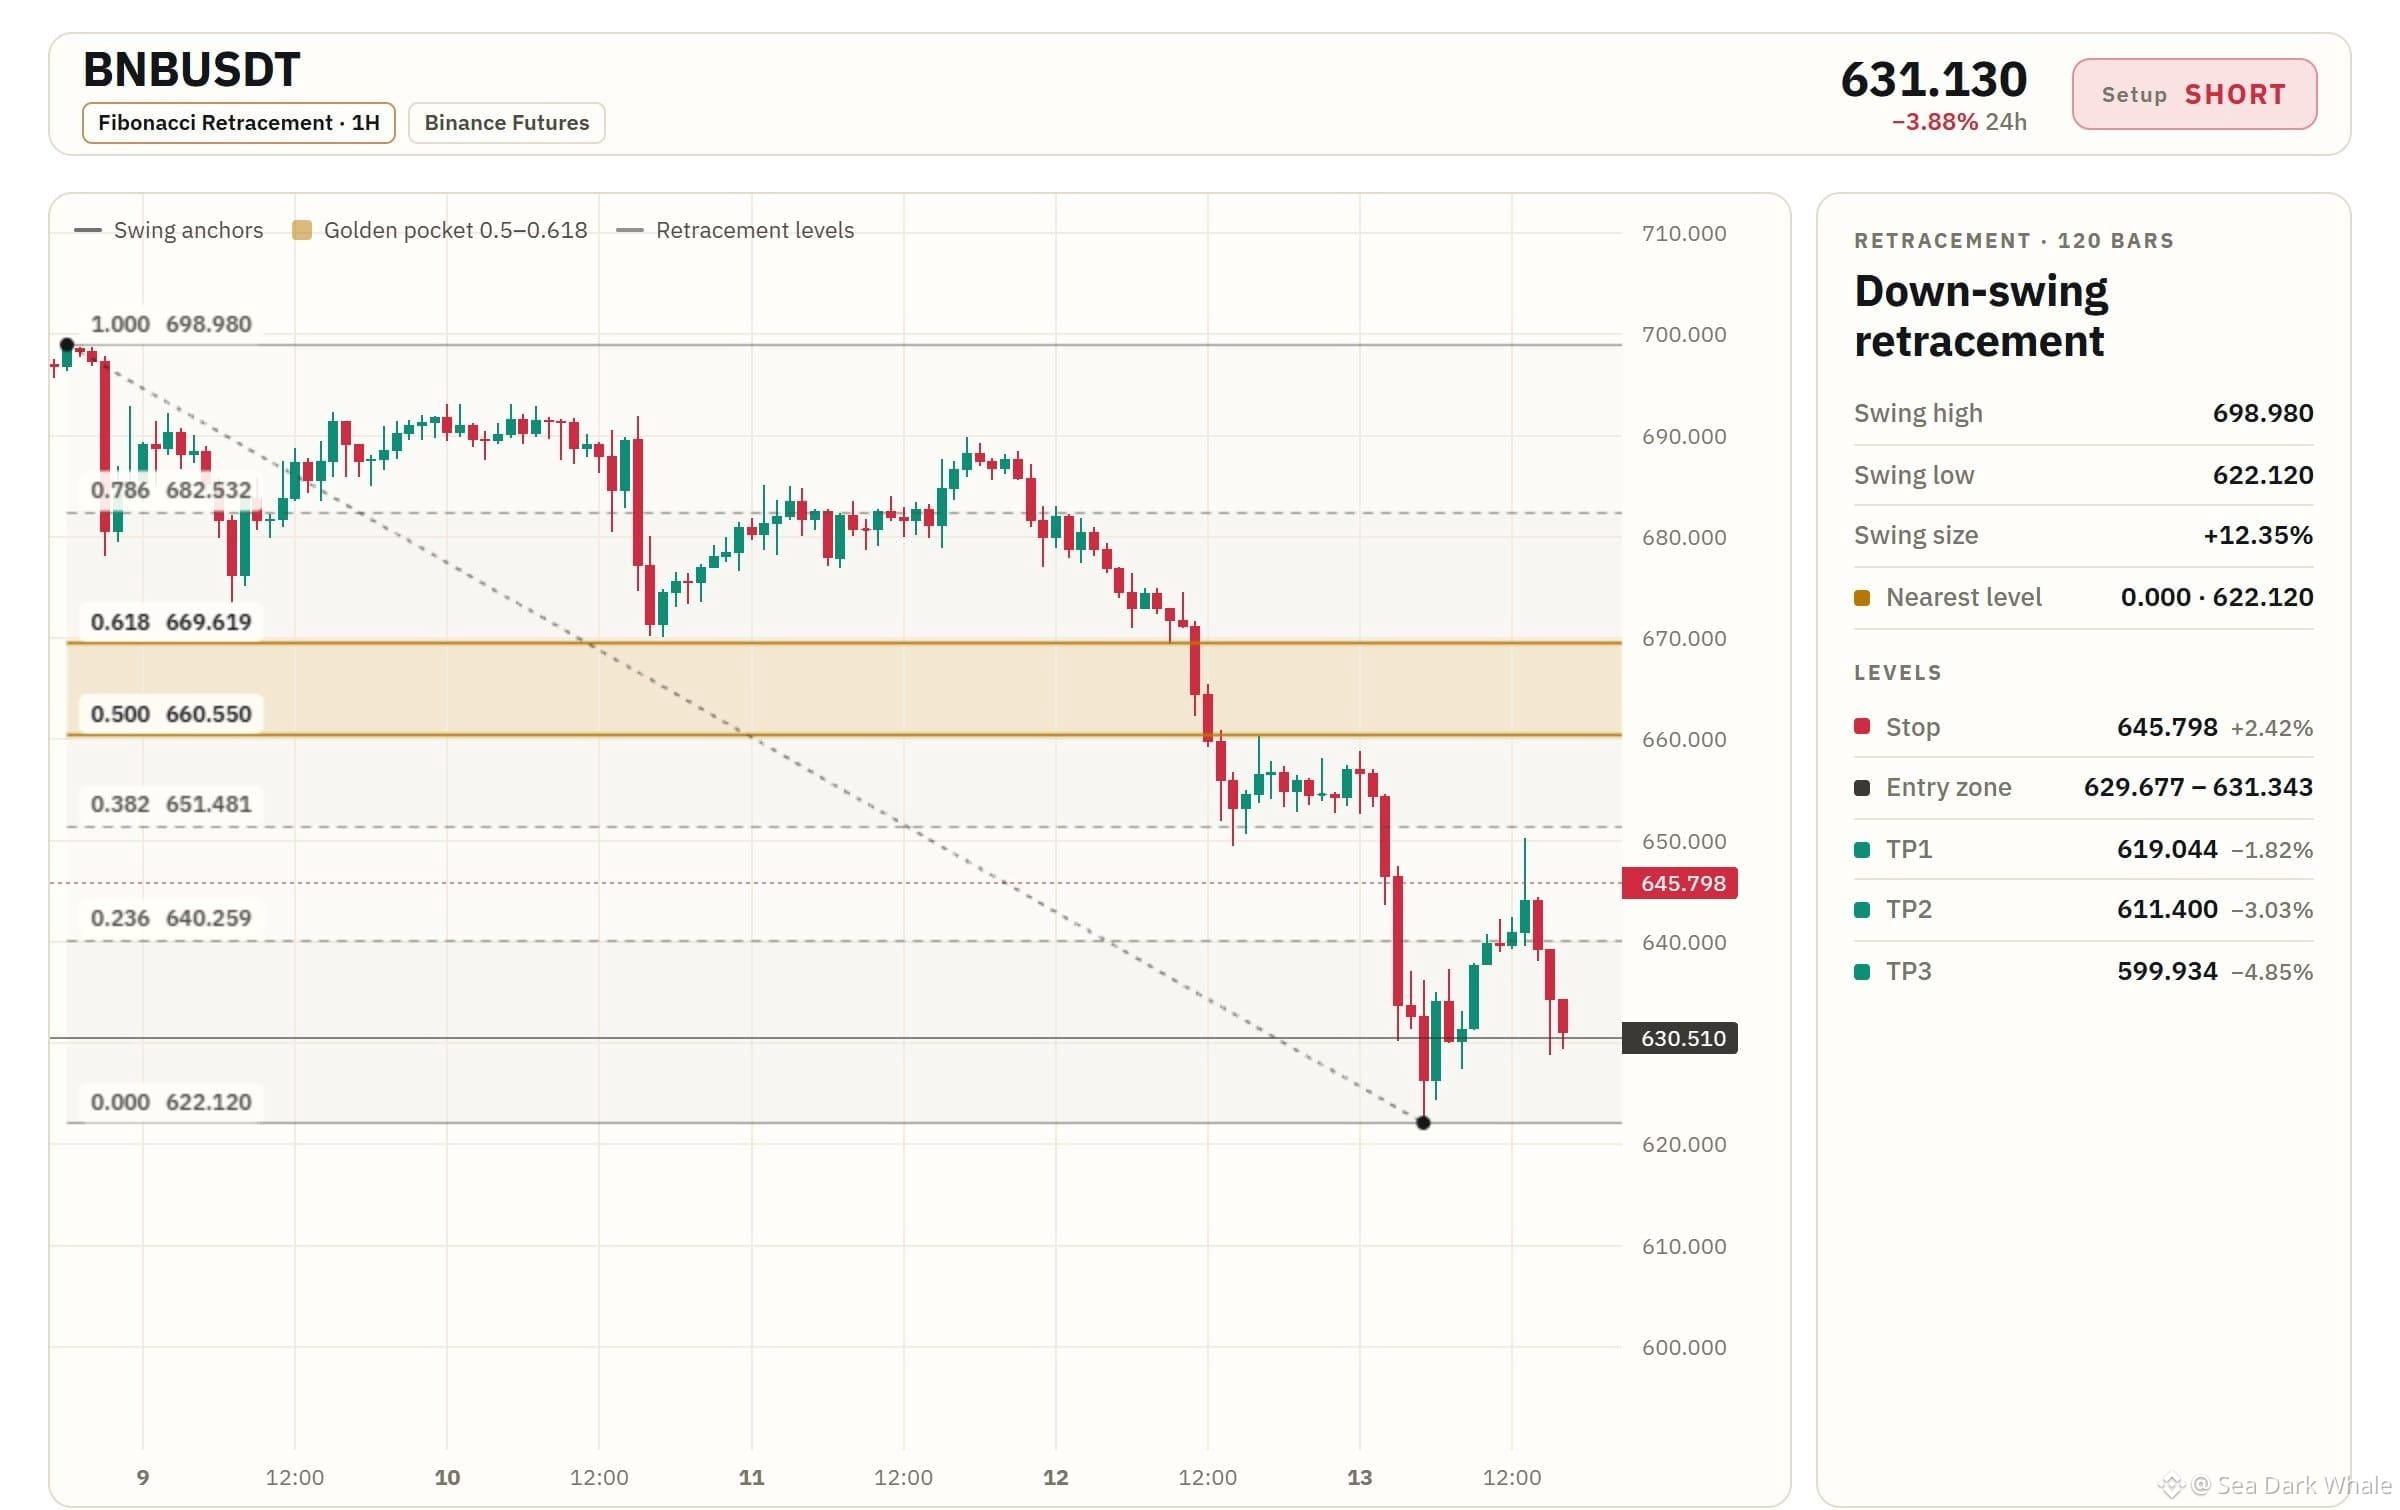
The Fibonacci picture frames the move: swing high 698.980, swing low 622.120, a 12.35% swing, and price now sitting right on the 0.000 level at 622.120. The golden pocket (0.5–0.618) is far above at 660.550–669.619, with the other retracement levels at 0.786 682.532, 0.382 651.481 and 0.236 640.259.
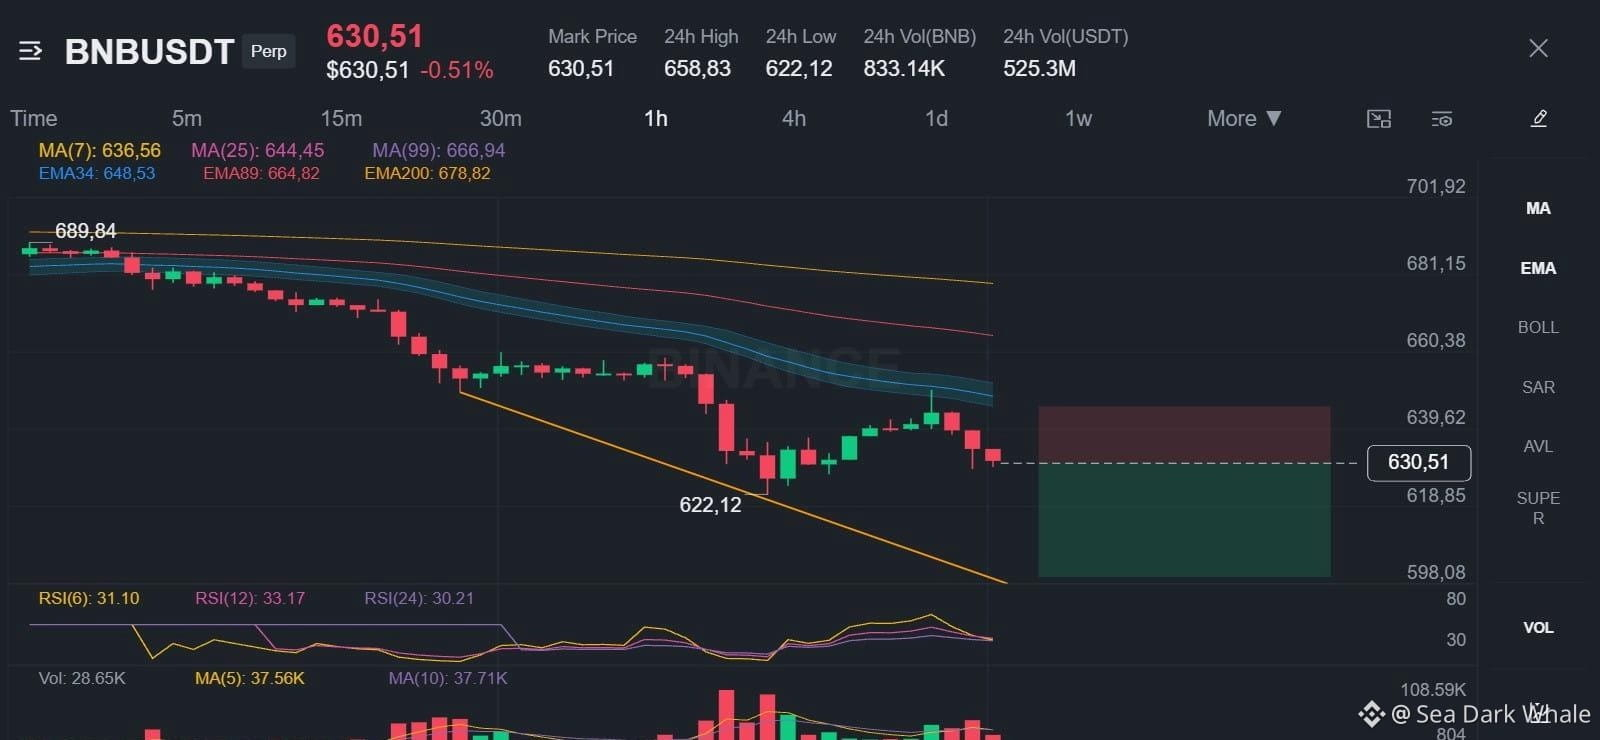
Chart check: last 630.51, down 0.51% on the session and 3.88% over 24h. 24h high 658.83 / low 622.12, 24h volume 833.14K BNB / 525.3M USDT. MA(7) 636.56, MA(25) 644.45, MA(99) 666.94, EMA34 648.53, EMA89 664.82, EMA200 678.82. RSI(6) 31.10, RSI(12) 33.17, RSI(24) 30.21, RSI 14 33.4. The 1H setup shows 6/12 signals aligned, 69% confidence and 2.00R reward/risk, with Bollinger 20,2 at 660.617 / 621.316 and 1H open 634.340, high 634.340, low 629.510, close 631.130.
One warning: price is stretched far below its average, so a bounce is likely — it is 3.8 ATR below the 1h EMA50.
Plan: bank 50% at TP1, 25% at TP2 and the last 25% at TP3, moving the stop to entry once TP1 hits.
Personal market analysis only — manage risk and DYOR.
Do you see BNB holding this short bias from here?
$BNB is trading under a bearish stack on the 4h and 1h, with price below EMA50 below EMA200, so the swing trend is still down and the call stays SHORT.
Entry: 629.677 – 631.343
TP1: 619.044 (-1.8%)
TP2: 611.400 (-3.0%)
TP3: 599.934 (-4.8%)
SL: 645.798 (+2.4%)
The Fibonacci picture frames the move: swing high 698.980, swing low 622.120, a 12.35% swing, and price now sitting right on the 0.000 level at 622.120. The golden pocket (0.5–0.618) is far above at 660.550–669.619, with the other retracement levels at 0.786 682.532, 0.382 651.481 and 0.236 640.259.
Chart check: last 630.51, down 0.51% on the session and 3.88% over 24h. 24h high 658.83 / low 622.12, 24h volume 833.14K BNB / 525.3M USDT. MA(7) 636.56, MA(25) 644.45, MA(99) 666.94, EMA34 648.53, EMA89 664.82, EMA200 678.82. RSI(6) 31.10, RSI(12) 33.17, RSI(24) 30.21, RSI 14 33.4. The 1H setup shows 6/12 signals aligned, 69% confidence and 2.00R reward/risk, with Bollinger 20,2 at 660.617 / 621.316 and 1H open 634.340, high 634.340, low 629.510, close 631.130.
One warning: price is stretched far below its average, so a bounce is likely — it is 3.8 ATR below the 1h EMA50.
Plan: bank 50% at TP1, 25% at TP2 and the last 25% at TP3, moving the stop to entry once TP1 hits.
Personal market analysis only — manage risk and DYOR.
Do you see BNB holding this short bias from here?