Is $TUT trapped under a bearish EMA stack — with a short setup eyeing 11.6% lower?
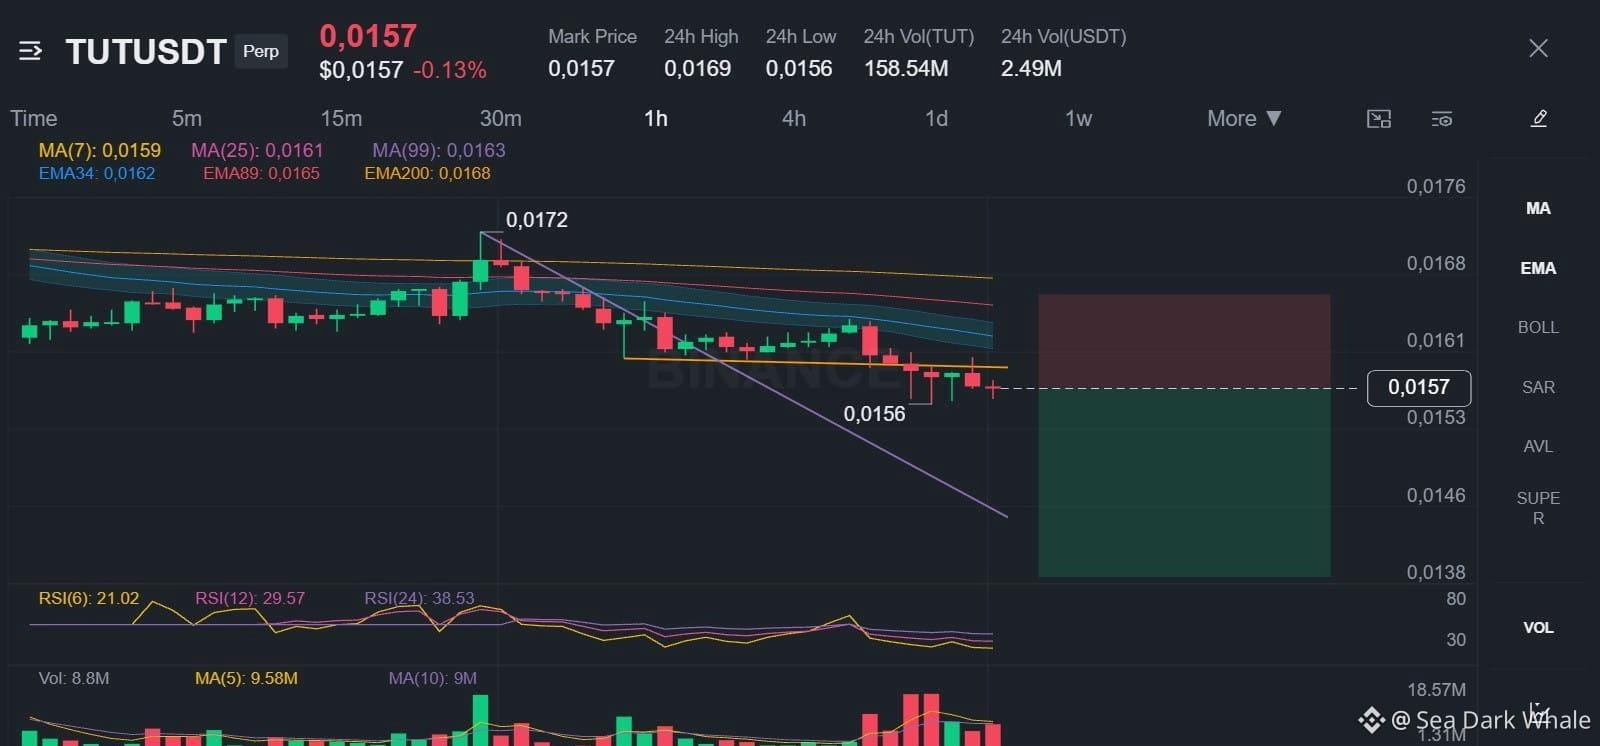
TUT is trading below its EMA50 and EMA200 on both the 4h and 1h, a clean bearish stack that keeps the swing trend pointing down. Last price 0.0157, down 7.04% in 24h, with the day's range running 0.0156 to 0.0169 on 158.54M TUT volume.
The plan:
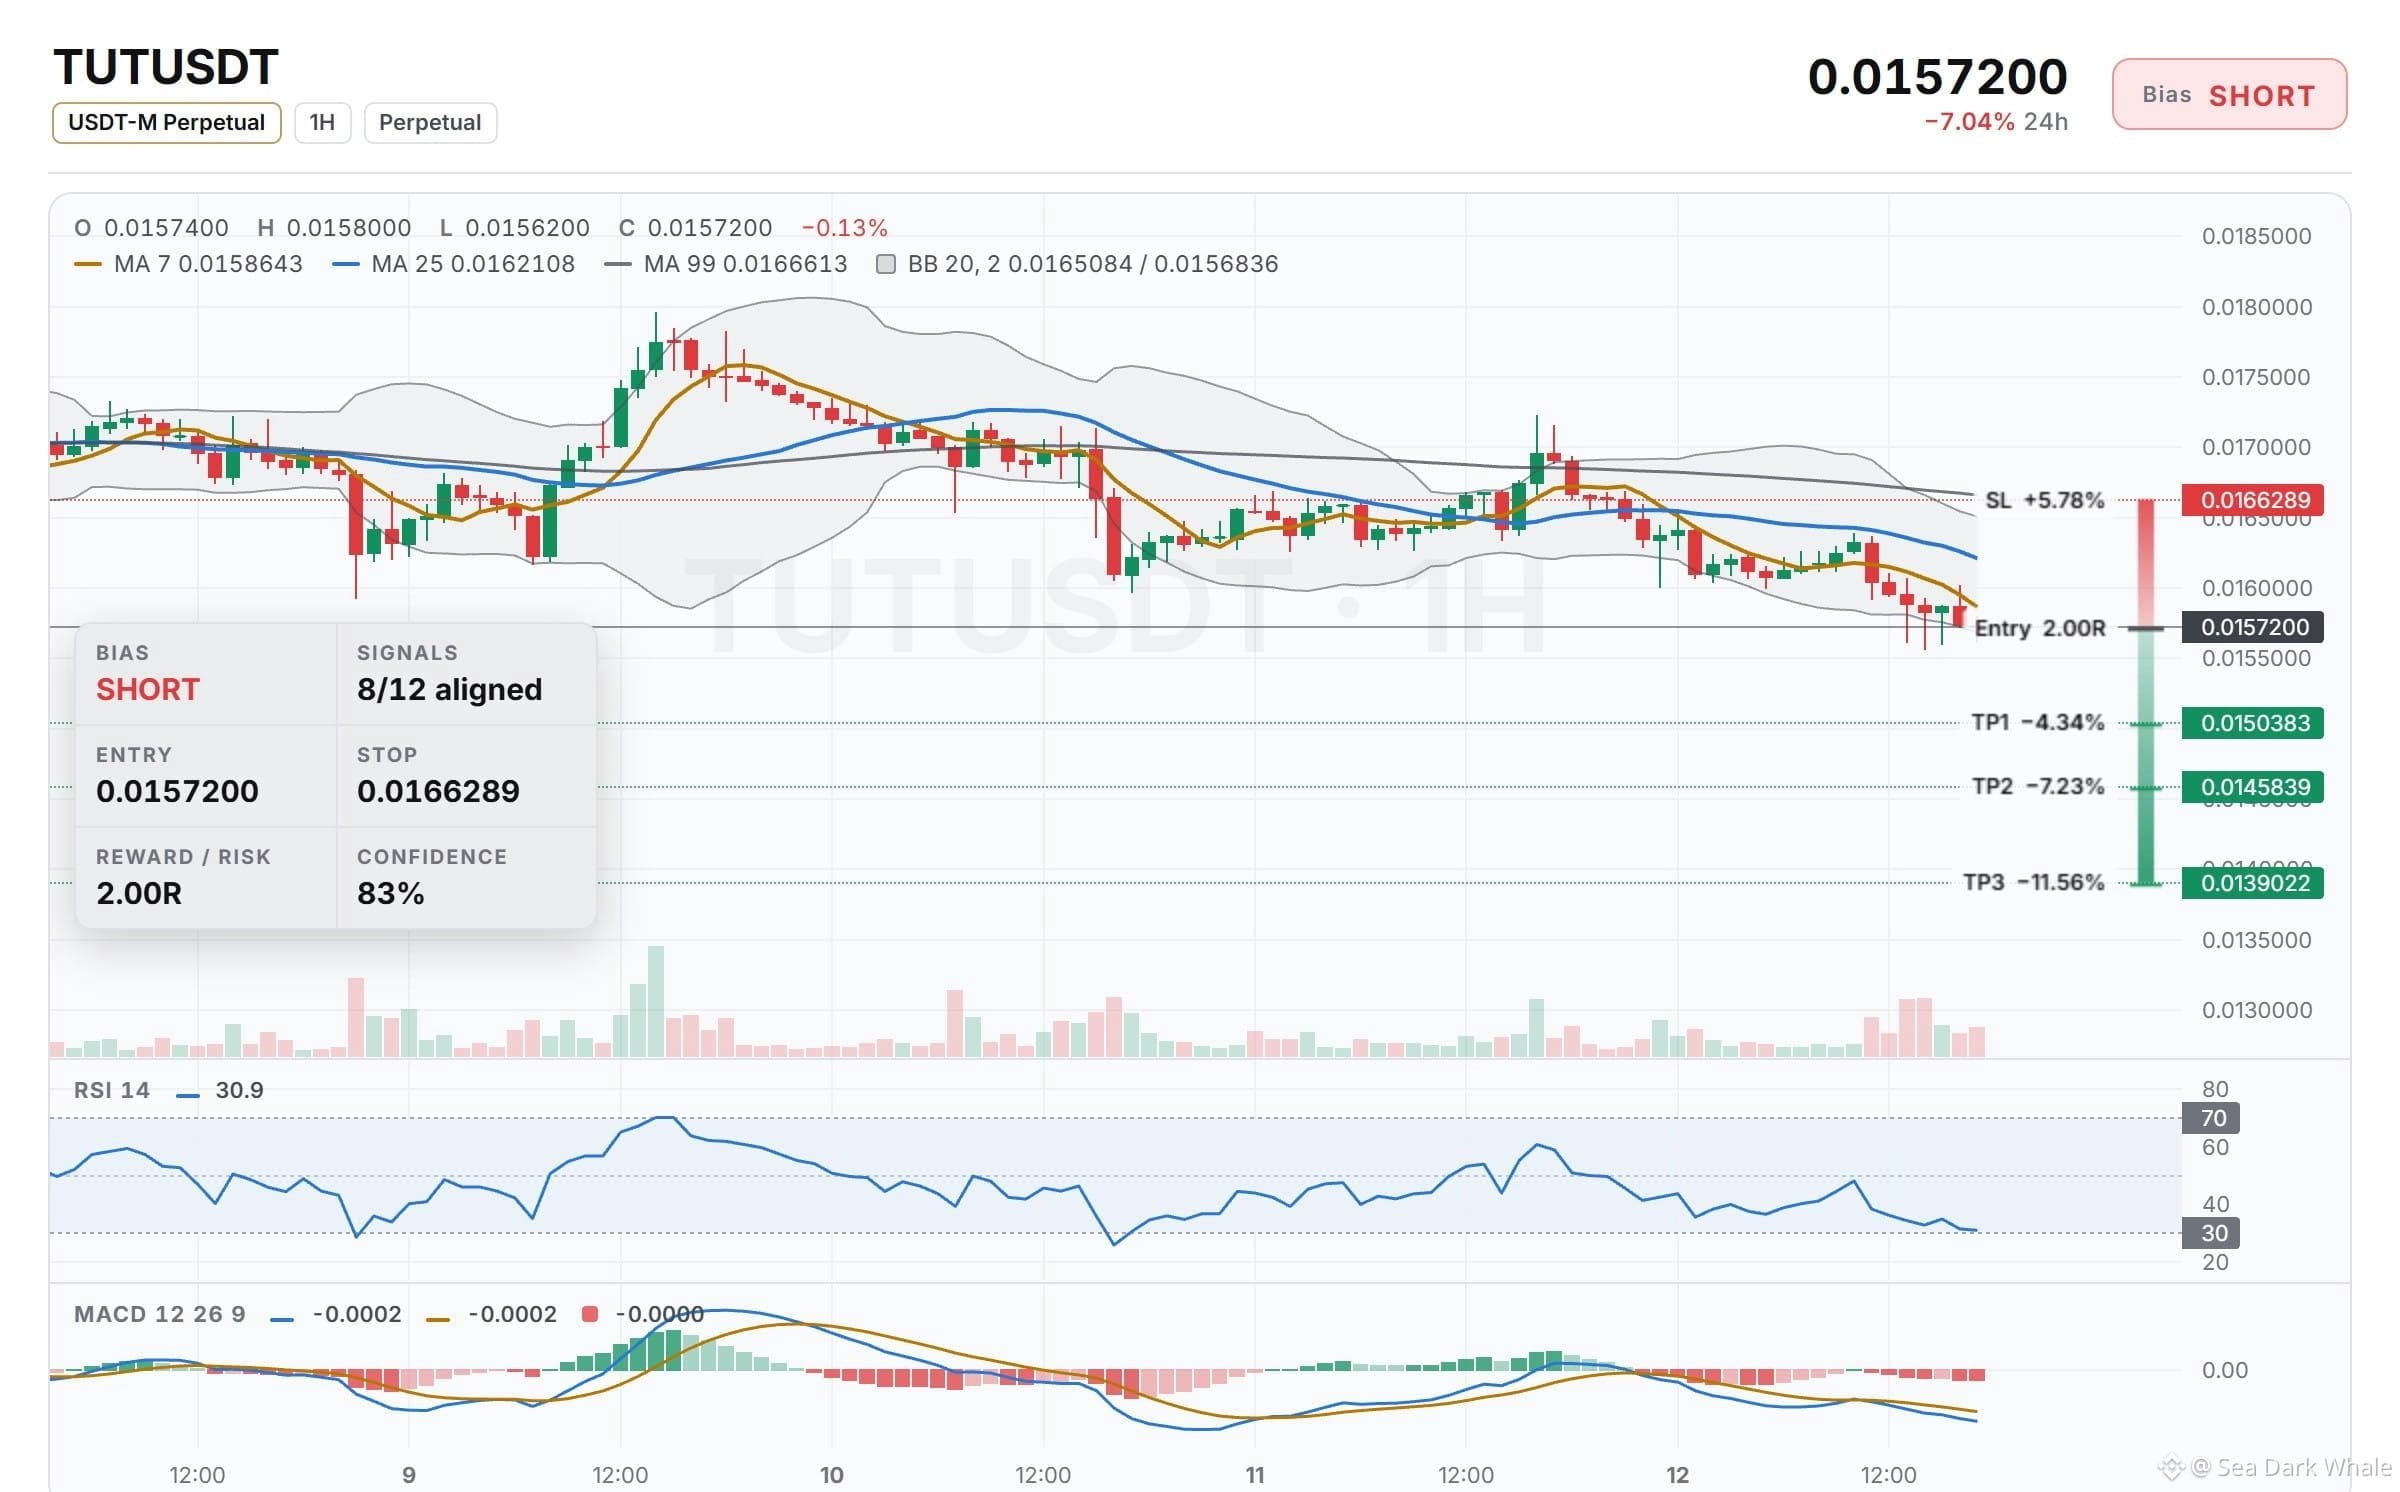
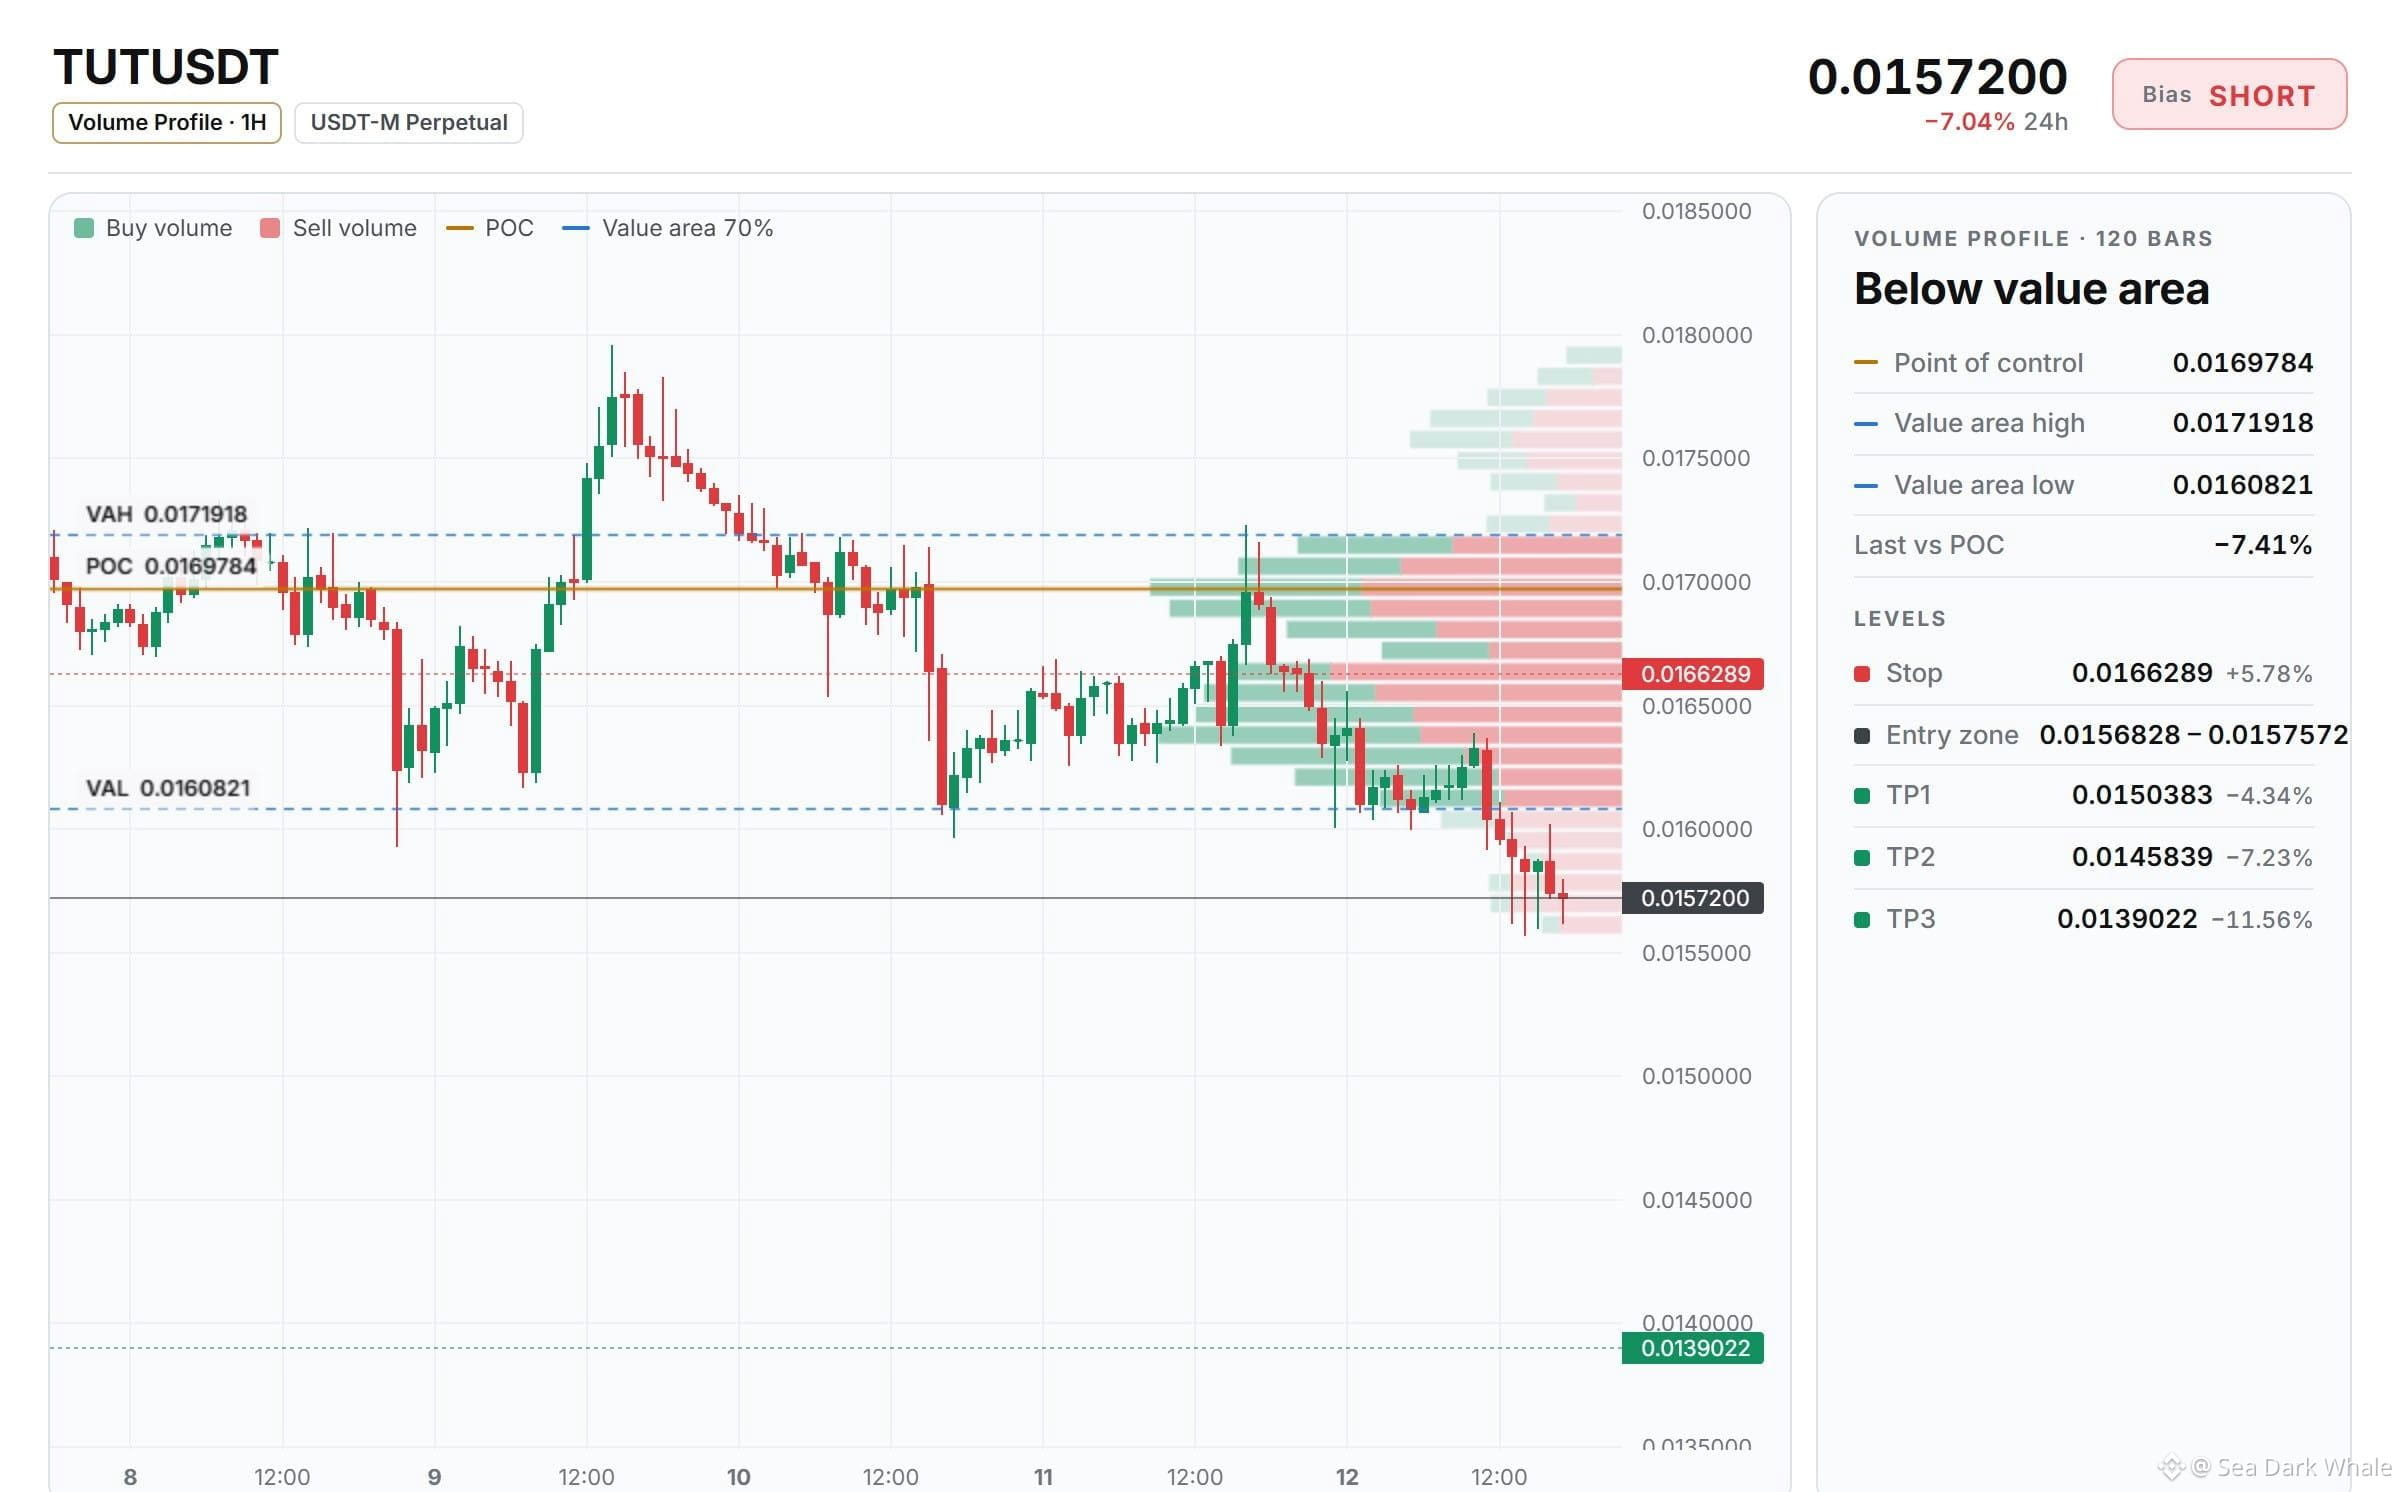
Entry: 0.0156828 – 0.0157572
TP1: 0.0150383 (-4.3%)
TP2: 0.0145839 (-7.2%)
TP3: 0.0139022 (-11.6%)
Stop: 0.0166289 (+5.8%)
Scale out 50% at TP1, 25% at TP2 and 25% at TP3, then move the stop to entry once TP1 hits. The setup carries 2.00R with 8 of 12 signals aligned, 83% confidence and RSI 14 at 30.9.
Where do you see TUT heading from here?
Personal market analysis only, not investment advice — manage risk.
TUT is trading below its EMA50 and EMA200 on both the 4h and 1h, a clean bearish stack that keeps the swing trend pointing down. Last price 0.0157, down 7.04% in 24h, with the day's range running 0.0156 to 0.0169 on 158.54M TUT volume.
The plan:
Entry: 0.0156828 – 0.0157572
TP1: 0.0150383 (-4.3%)
TP2: 0.0145839 (-7.2%)
TP3: 0.0139022 (-11.6%)
Stop: 0.0166289 (+5.8%)
Scale out 50% at TP1, 25% at TP2 and 25% at TP3, then move the stop to entry once TP1 hits. The setup carries 2.00R with 8 of 12 signals aligned, 83% confidence and RSI 14 at 30.9.
Where do you see TUT heading from here?
Personal market analysis only, not investment advice — manage risk.