
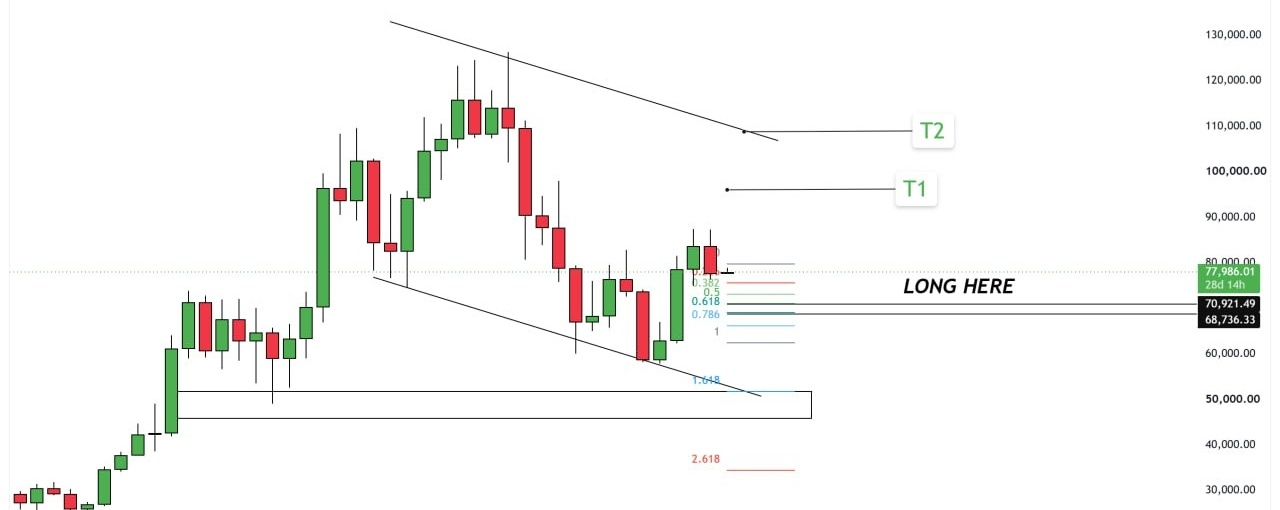

Bitcoin (BTC) is showing signs of recovery within a descending channel, with the chart currently quoting around $78,000.
The key support zone lies between $68,736 and $70,921, where important Fibonacci retracement levels overlap. Holding this zone could be crucial for Bitcoin's next major move.
🚀 Bullish Scenario:
If BTC maintains its key support, reclaims $80,000, and breaks above the $83,000–$87,000 resistance zone, the next potential targets could be:
- T1: $96,000
- T2: $108,000
- T3: $110,000
⚠️ Bearish Scenario:
A monthly candle close below $68,700 could invalidate the recovery setup and expose lower support zones:
- $62,000–$65,000
- $58,000–$60,000
My View: Bitcoin is approaching a critical monthly decision zone. The next confirmed monthly close could provide a clearer direction for the market.
Stay patient, watch the key levels, and manage your risk.
#Bitcoin #BTC #Crypto #BitcoinAnalysis #TechnicalAnalysis #CryptoMarket #BTCUSDT #BinanceSquare
Not financial advice. Trade at your own risk.