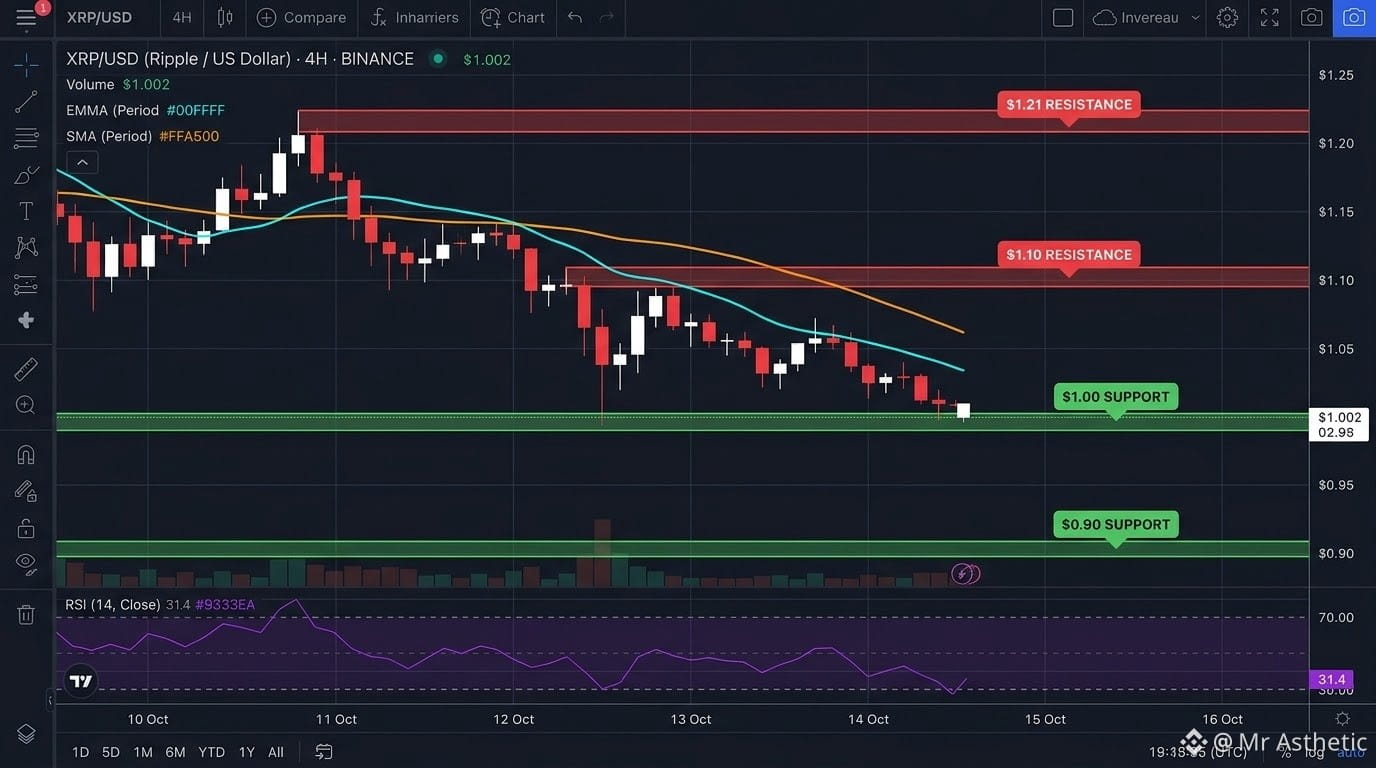
As of mid-November 2026, $XRP is trading in a defensive range around $1.04–$1.07, testing major psychological and structural support near the $1.00 mark. Despite Bitcoin showing resilience above $74,000, XRP has faced sustained downward pressure over the past week, driven by ETF outflows and broader altcoin liquidity tightening.
Technical Breakdown & Indicators
Trend & Moving Averages: The daily (D1) and weekly (W1) trends remain distinctly bearish. XRP is trading below its 20-day EMA, 50-day EMA, and 200-day/200-week Simple Moving Averages, all of which are sloping downward and acting as overhead dynamic resistance.
Momentum Oscillators: The 14-day Relative Strength Index (RSI) sits near 42–43, reflecting weak buying momentum without yet reaching extreme oversold territory (<30). MACD remains in negative territory, confirming that sellers still control short-term price action.
On-Chain & Derivatives Sentiment: Futures open interest and leverage on major exchanges have cooled to multi-month lows as long traders pay funding to hold positions. Conversely, on-chain data shows large whale wallets growing by ~5% during the recent pullback, indicating quiet spot accumulation near the $1.00 threshold.
Bullish Scenario: Buyers defend the $0.99–$1.00 zone on high spot volume, forcing a short squeeze back above $1.10. Clearing $1.21 would shift momentum back toward the $1.30 resistance cluster. Additionally, progress on the XRP Ledger's native lending protocol—currently awaiting final validator majority votes—remains a key fundamental catalyst.
Bearish Scenario: Continued institutional ETF outflows or a broader macro risk-off move drags XRP to a decisive daily close below $0.99, opening the door to deeper retracements toward the low $0.90s before stronger long-term bids step in.#AnthropicRejectsIPODelayValuationinQuestion #CanNvidiaEarningsEaseMarketConcerns? #CoreWeaveJumps10%On168%RevenueGrowth
Technical Breakdown & Indicators
Trend & Moving Averages: The daily (D1) and weekly (W1) trends remain distinctly bearish. XRP is trading below its 20-day EMA, 50-day EMA, and 200-day/200-week Simple Moving Averages, all of which are sloping downward and acting as overhead dynamic resistance.
Momentum Oscillators: The 14-day Relative Strength Index (RSI) sits near 42–43, reflecting weak buying momentum without yet reaching extreme oversold territory (<30). MACD remains in negative territory, confirming that sellers still control short-term price action.
On-Chain & Derivatives Sentiment: Futures open interest and leverage on major exchanges have cooled to multi-month lows as long traders pay funding to hold positions. Conversely, on-chain data shows large whale wallets growing by ~5% during the recent pullback, indicating quiet spot accumulation near the $1.00 threshold.
Bullish Scenario: Buyers defend the $0.99–$1.00 zone on high spot volume, forcing a short squeeze back above $1.10. Clearing $1.21 would shift momentum back toward the $1.30 resistance cluster. Additionally, progress on the XRP Ledger's native lending protocol—currently awaiting final validator majority votes—remains a key fundamental catalyst.
Bearish Scenario: Continued institutional ETF outflows or a broader macro risk-off move drags XRP to a decisive daily close below $0.99, opening the door to deeper retracements toward the low $0.90s before stronger long-term bids step in.#AnthropicRejectsIPODelayValuationinQuestion #CanNvidiaEarningsEaseMarketConcerns? #CoreWeaveJumps10%On168%RevenueGrowth