$SPCXB : Subjective Charting and Expectancy Bias
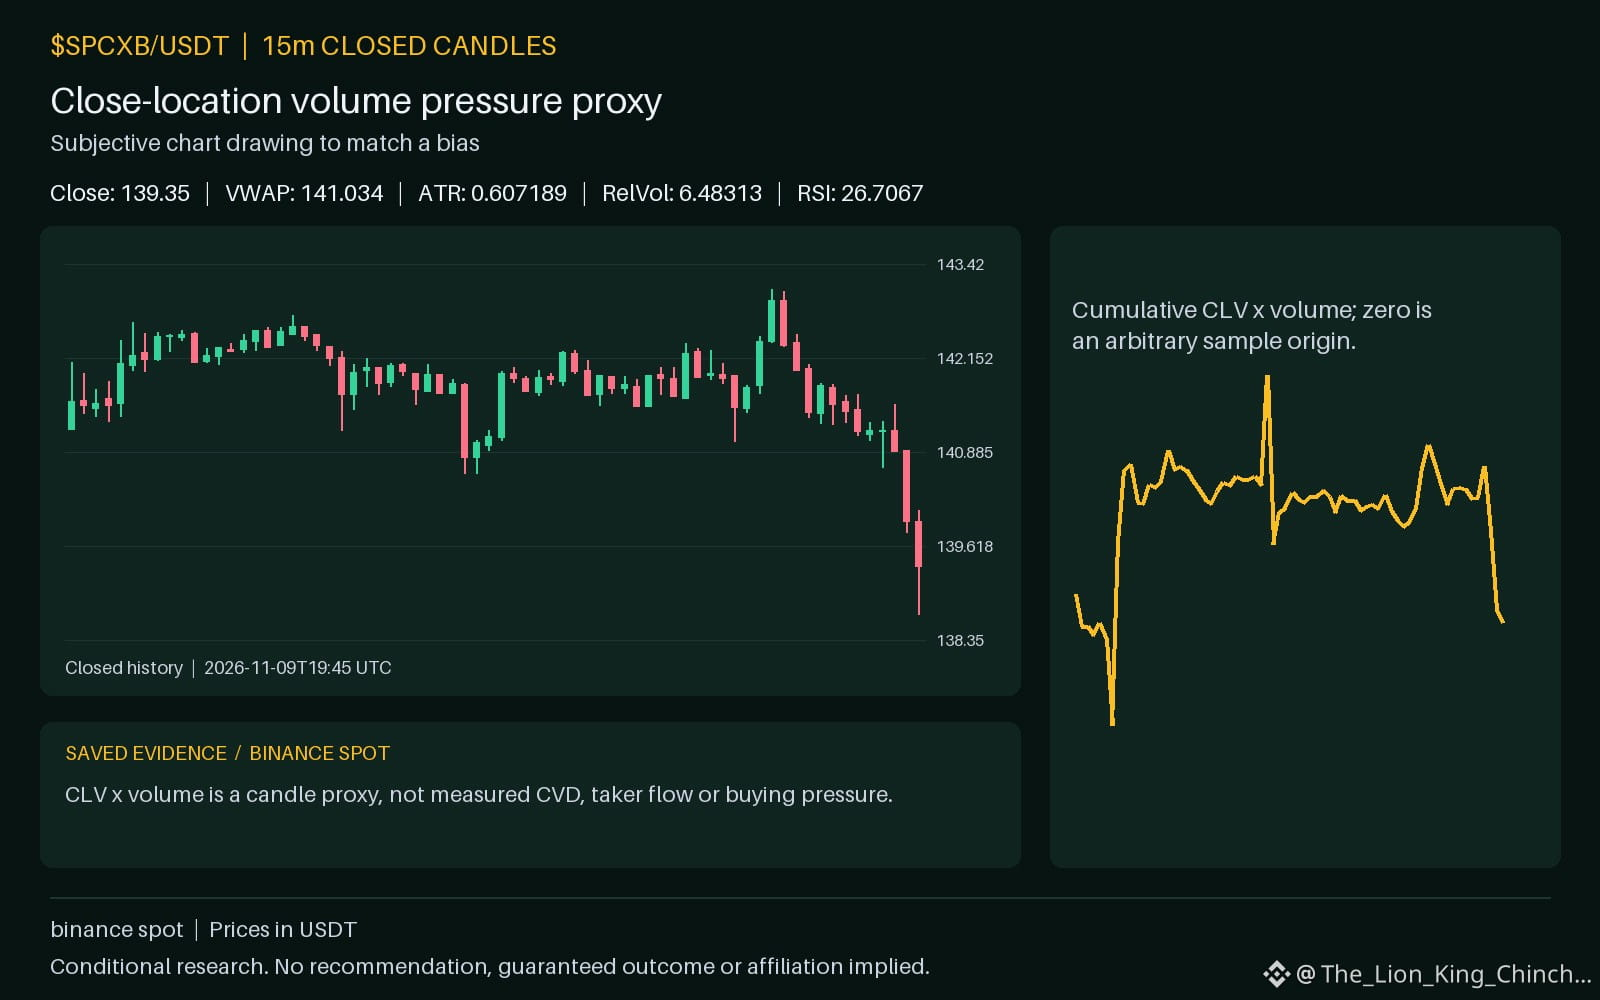
The current market data for $SPCXB shows the price at 139.35, positioned below the primary support of 139.8. With an RSI of 26.7067 and a daily change of 0.941688, the asset is moving with relative volume at 6.48313. These numbers provide a snapshot of a range break, but how we interpret them often depends on our internal state.
When a researcher expects a bounce, they might face the observer-expectancy effect. This is the tendency to subconsciously manipulate data to reach a desired conclusion. For instance, if the hourly direction is down, a person might move a support line lower on the chart to avoid admitting a breakdown has occurred. This subjective adjustment creates a false sense of security.
A hypothetical counterexample would be a researcher who draws multiple trendlines and ignores the one that was breached, focusing instead on a steeper line that remains intact. To check this bias, ask yourself: would I draw this line exactly the same way if I had no stake in the outcome? Try removing all drawings and starting fresh with only hard metrics like 141.247 or the daily VWAP of 141.034. Comparing your original drawing to one made with neutral rules helps identify if you are adjusting the chart to fit a bias.
Probabilistic market research, not a recommendation or guaranteed return.
Have you ever caught yourself slightly adjusting a trendline just to make a chart look like it hasn't broken down yet?
#SPCXB #TradingPsychology #CryptoLearning
The current market data for $SPCXB shows the price at 139.35, positioned below the primary support of 139.8. With an RSI of 26.7067 and a daily change of 0.941688, the asset is moving with relative volume at 6.48313. These numbers provide a snapshot of a range break, but how we interpret them often depends on our internal state.
When a researcher expects a bounce, they might face the observer-expectancy effect. This is the tendency to subconsciously manipulate data to reach a desired conclusion. For instance, if the hourly direction is down, a person might move a support line lower on the chart to avoid admitting a breakdown has occurred. This subjective adjustment creates a false sense of security.
A hypothetical counterexample would be a researcher who draws multiple trendlines and ignores the one that was breached, focusing instead on a steeper line that remains intact. To check this bias, ask yourself: would I draw this line exactly the same way if I had no stake in the outcome? Try removing all drawings and starting fresh with only hard metrics like 141.247 or the daily VWAP of 141.034. Comparing your original drawing to one made with neutral rules helps identify if you are adjusting the chart to fit a bias.
Probabilistic market research, not a recommendation or guaranteed return.
Have you ever caught yourself slightly adjusting a trendline just to make a chart look like it hasn't broken down yet?
#SPCXB #TradingPsychology #CryptoLearning