
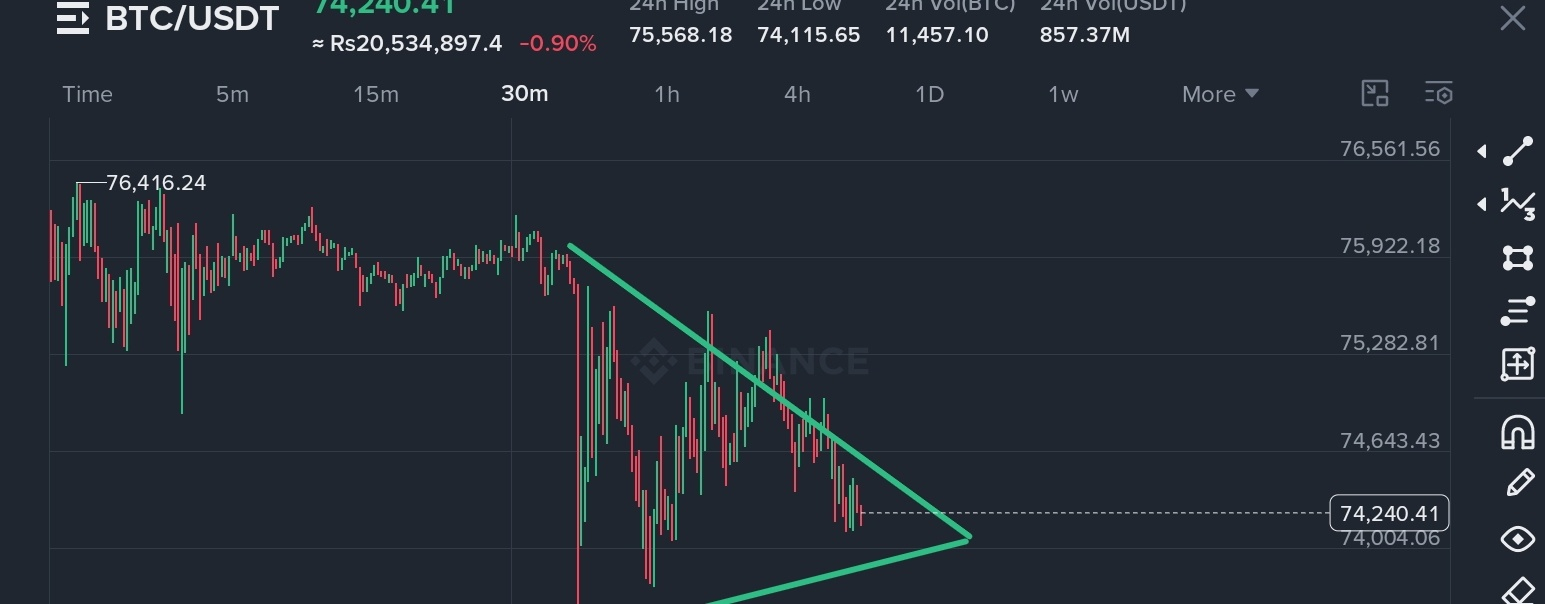

Bitcoin is testing the lower boundary of a triangle pattern on the 30-minute chart, with sellers attempting to push price below this key support zone. 👀
A confirmed breakdown—especially if accompanied by stronger volume—could increase short-term volatility and put additional pressure on leveraged long positions. However, a quick recovery back inside the pattern would suggest that the breakdown attempt has not yet gained confirmation.
📌 What to watch:
Whether the 30-minute candle closes decisively below triangle support
Volume during the move: stronger selling volume may indicate increased downside pressure
Any reclaim of the broken support area, which could signal a false breakdown
Funding, open interest, and broader market sentiment before taking leveraged exposure
⚠️ Traders using leverage should stay alert to rapid swings and manage risk according to their own plan. Market structure can change quickly, and a single pattern alone does not guarantee the next move.#BTC #BinanceSquareFamily $BTC
