🚀
$ETH (ETH) – DAILY MARKET ANALYSIS
📅 November 10, 2026
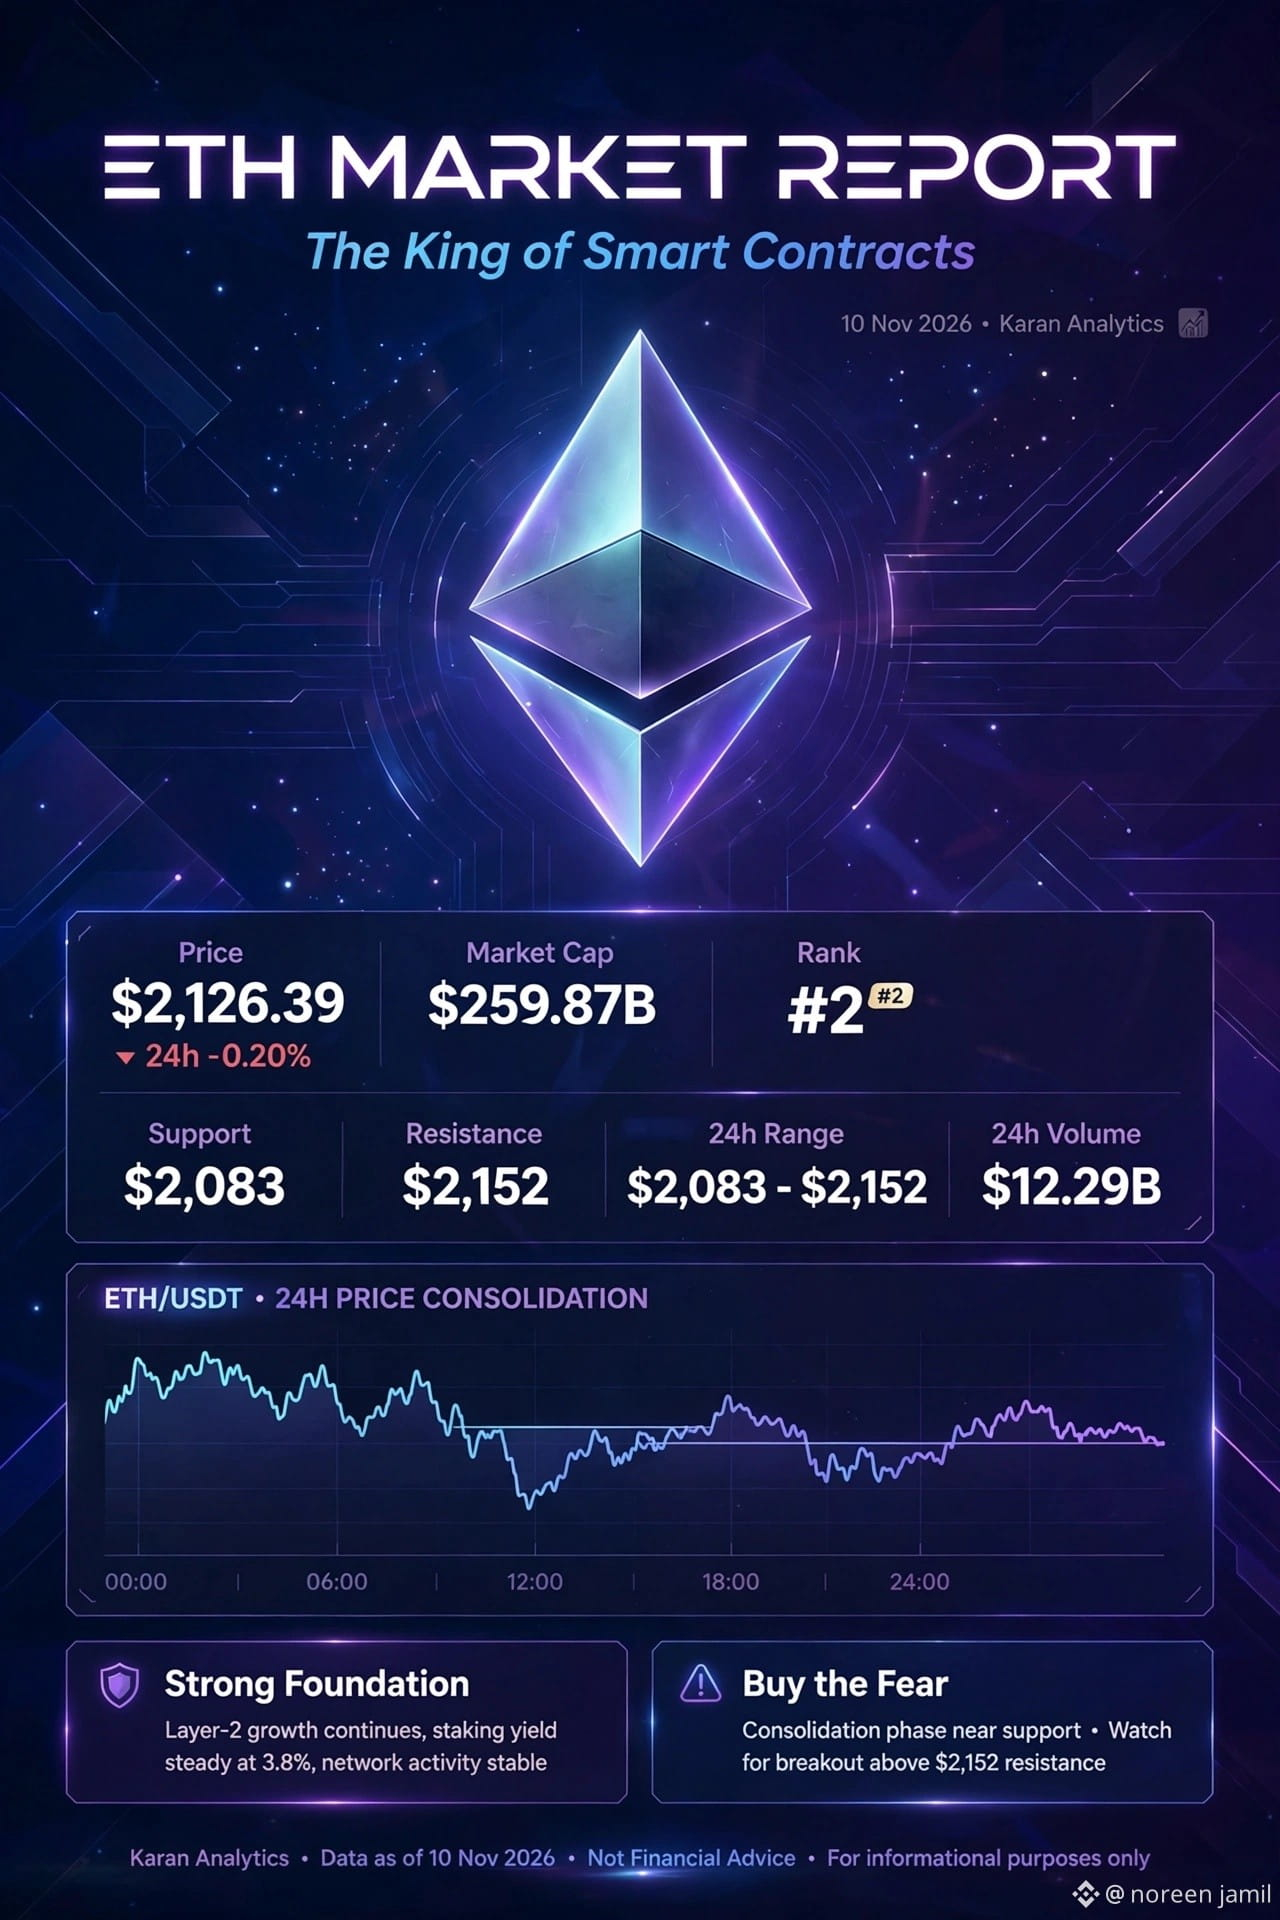
💰 CURRENT MARKET OVERVIEW
Current Price: $2,113.40
24H Change: -1.23%
24H High: $2,151.30
24H Low: $2,081.40
Market Cap: $258.13 Billion
7-Day Performance: -7.01%
📊 KEY TECHNICAL LEVELS
🟢 Support Zones
S1: $2,080
S2: $2,050
🔴 Resistance Zones
R1: $2,150
R2: $2,200
📈 MARKET OUTLOOK
Bullish Scenario 🟢
If ETH moves above $2,150 and maintains strength, a recovery towards $2,200 could become possible.
Bearish Scenario 🔴
If ETH loses the $2,080 support zone, further downside pressure may develop.
🔥 WHAT TO WATCH
Bitcoin market direction
ETH trading volume
Key support and resistance levels
Overall crypto market sentiment
🎯 FINAL ANALYSIS
Ethereum is currently facing short-term selling pressure. A confirmed move above resistance or below support will help clarify its next market direction.
⚠️ DISCLAIMER: This is an educational market analysis, not financial advice. Cryptocurrency prices are highly volatile.
#ETH #Ethereum #ETHAnalysis #CryptoMarket #EthereumNews #TechnicalAnalysis #CryptoUpdate #Blockchain #Altcoins
$ETH (ETH) – DAILY MARKET ANALYSIS
📅 November 10, 2026
💰 CURRENT MARKET OVERVIEW
Current Price: $2,113.40
24H Change: -1.23%
24H High: $2,151.30
24H Low: $2,081.40
Market Cap: $258.13 Billion
7-Day Performance: -7.01%
📊 KEY TECHNICAL LEVELS
🟢 Support Zones
S1: $2,080
S2: $2,050
🔴 Resistance Zones
R1: $2,150
R2: $2,200
📈 MARKET OUTLOOK
Bullish Scenario 🟢
If ETH moves above $2,150 and maintains strength, a recovery towards $2,200 could become possible.
Bearish Scenario 🔴
If ETH loses the $2,080 support zone, further downside pressure may develop.
🔥 WHAT TO WATCH
Bitcoin market direction
ETH trading volume
Key support and resistance levels
Overall crypto market sentiment
🎯 FINAL ANALYSIS
Ethereum is currently facing short-term selling pressure. A confirmed move above resistance or below support will help clarify its next market direction.
⚠️ DISCLAIMER: This is an educational market analysis, not financial advice. Cryptocurrency prices are highly volatile.
#ETH #Ethereum #ETHAnalysis #CryptoMarket #EthereumNews #TechnicalAnalysis #CryptoUpdate #Blockchain #Altcoins