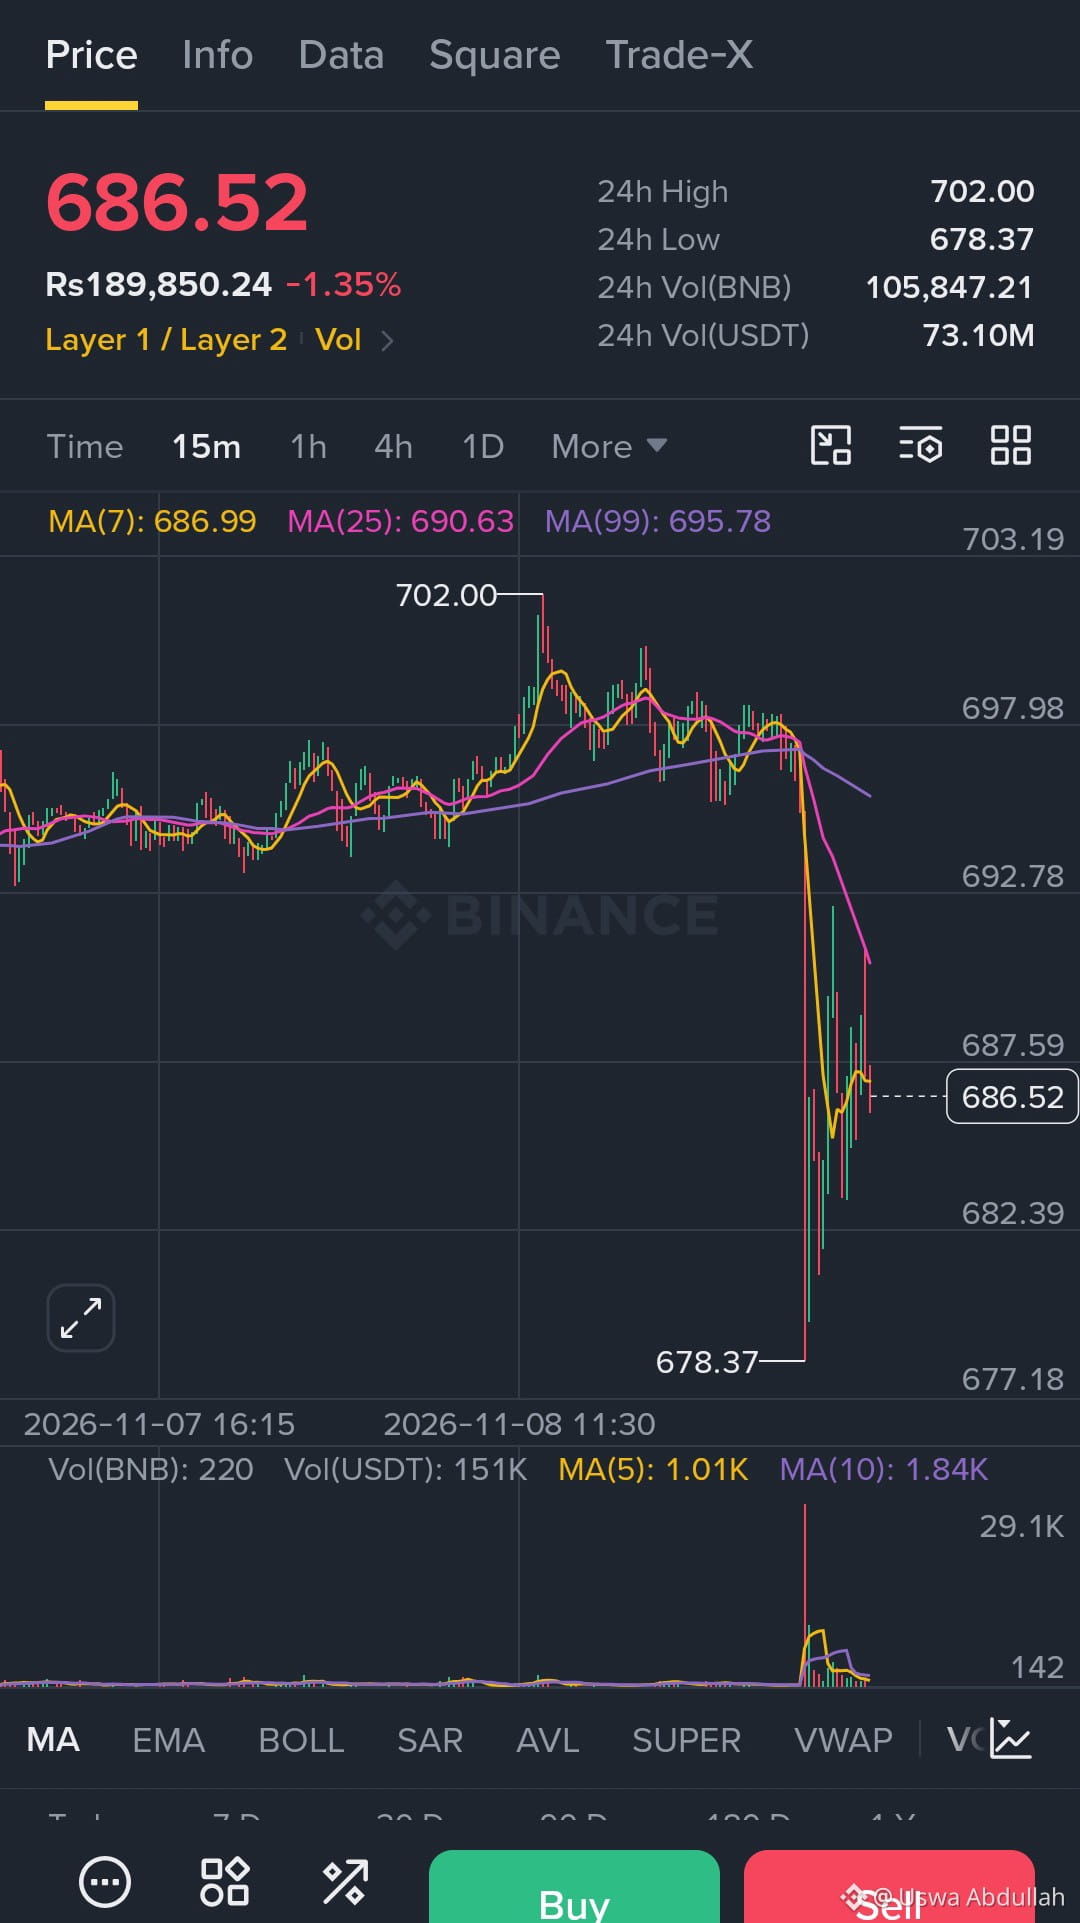
#BNBUSDT 🔥🔥👀 Short Analysis 📉👇👇😎
#BitcoinFiveWeeklyLosses #AIChipSlumpNasdaq
$BNB experienced a sharp sell-off from the $696–$698 area, hitting a low of $678.37. The current price is showing a recovery bounce, but the overall 15-minute trend remains weak.
Technical analysis
* MA(7): $686.99
* MA(25): $690.63
* MA(99): $695.78
$BNB is trading below all three moving averages. The large sell candle and volume spike indicate strong selling pressure. The current bounce may be a temporary recovery rather than a confirmed reversal.
Short-term price prediction
Resistance
$687.60 – $690.60
Support 1
$682.40
Support 2
$678.37
Breakdown target
$675 – $672
Trade setup (potential short)
| Parameter | Price |
| ---------- | --------------- |
| Entry zone | $687.50–$690.00 |
| Stop Loss | $692.00 |
| TP1 | $682.40 |
| TP2 | $678.40 |
| TP3 | $675.00 |
Trade confirmation: Wait for rejection near $688–$690 before considering a short. A breakdown below $682.40 could open the way toward $678.37.
Bullish reversal: If $BNB reclaims $690.60 and holds above it, the short setup weakens. A move above $695.80 would indicate stronger recovery potential.
#BitcoinFiveWeeklyLosses #AIChipSlumpNasdaq
$BNB experienced a sharp sell-off from the $696–$698 area, hitting a low of $678.37. The current price is showing a recovery bounce, but the overall 15-minute trend remains weak.
Technical analysis
* MA(7): $686.99
* MA(25): $690.63
* MA(99): $695.78
$BNB is trading below all three moving averages. The large sell candle and volume spike indicate strong selling pressure. The current bounce may be a temporary recovery rather than a confirmed reversal.
Short-term price prediction
Resistance
$687.60 – $690.60
Support 1
$682.40
Support 2
$678.37
Breakdown target
$675 – $672
Trade setup (potential short)
| Parameter | Price |
| ---------- | --------------- |
| Entry zone | $687.50–$690.00 |
| Stop Loss | $692.00 |
| TP1 | $682.40 |
| TP2 | $678.40 |
| TP3 | $675.00 |
Trade confirmation: Wait for rejection near $688–$690 before considering a short. A breakdown below $682.40 could open the way toward $678.37.
Bullish reversal: If $BNB reclaims $690.60 and holds above it, the short setup weakens. A move above $695.80 would indicate stronger recovery potential.