


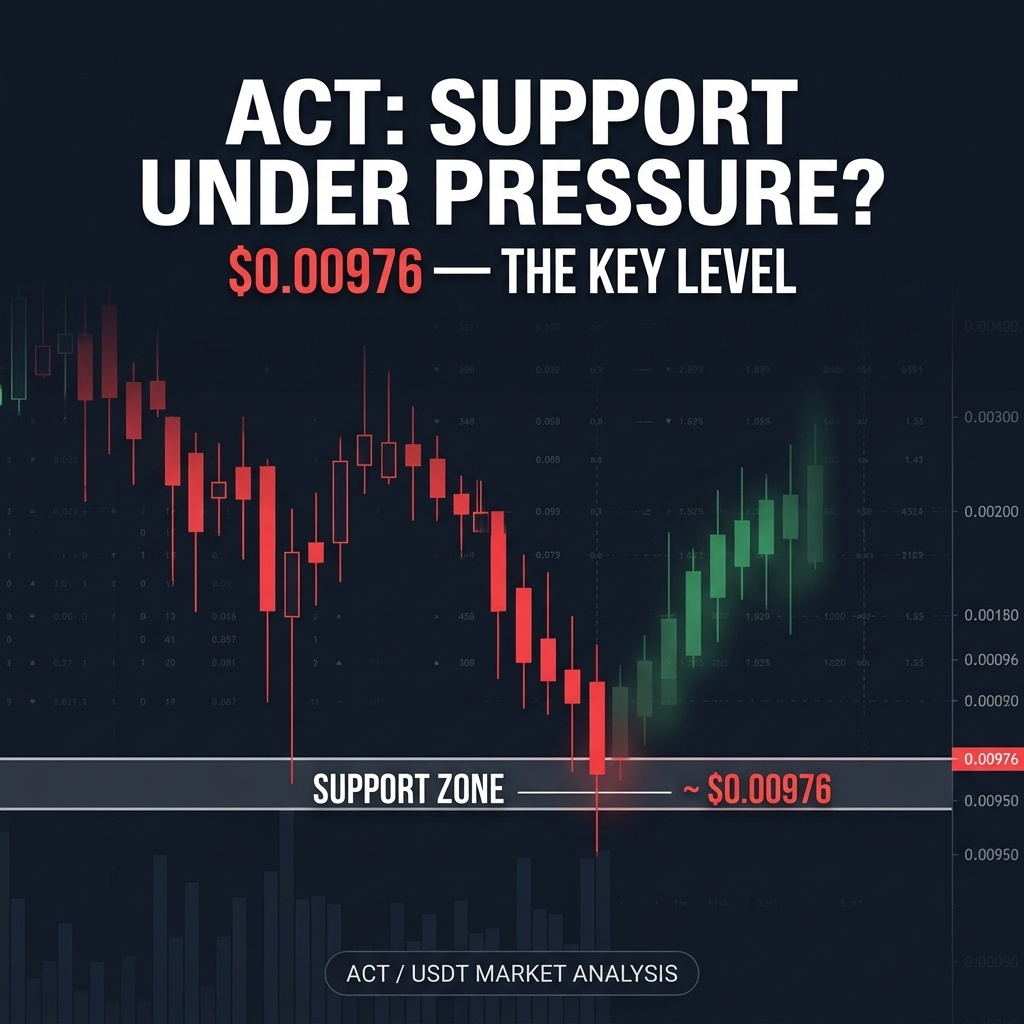
ACT/USDT is facing significant selling pressure after dropping 14.73%, bringing its price close to the 24-hour low of $0.009762.
But the bigger question is not simply how far ACT has fallen. It is whether buyers can defend the current support area and build a meaningful recovery.
Based on the chart snapshot, ACT is showing mixed signals across different timeframes. Short-term momentum remains weak, while the daily chart still has some signs of a broader recovery structure.
Let's break down the important levels.
1. 15-Minute Chart: Short-Term Pressure Remains
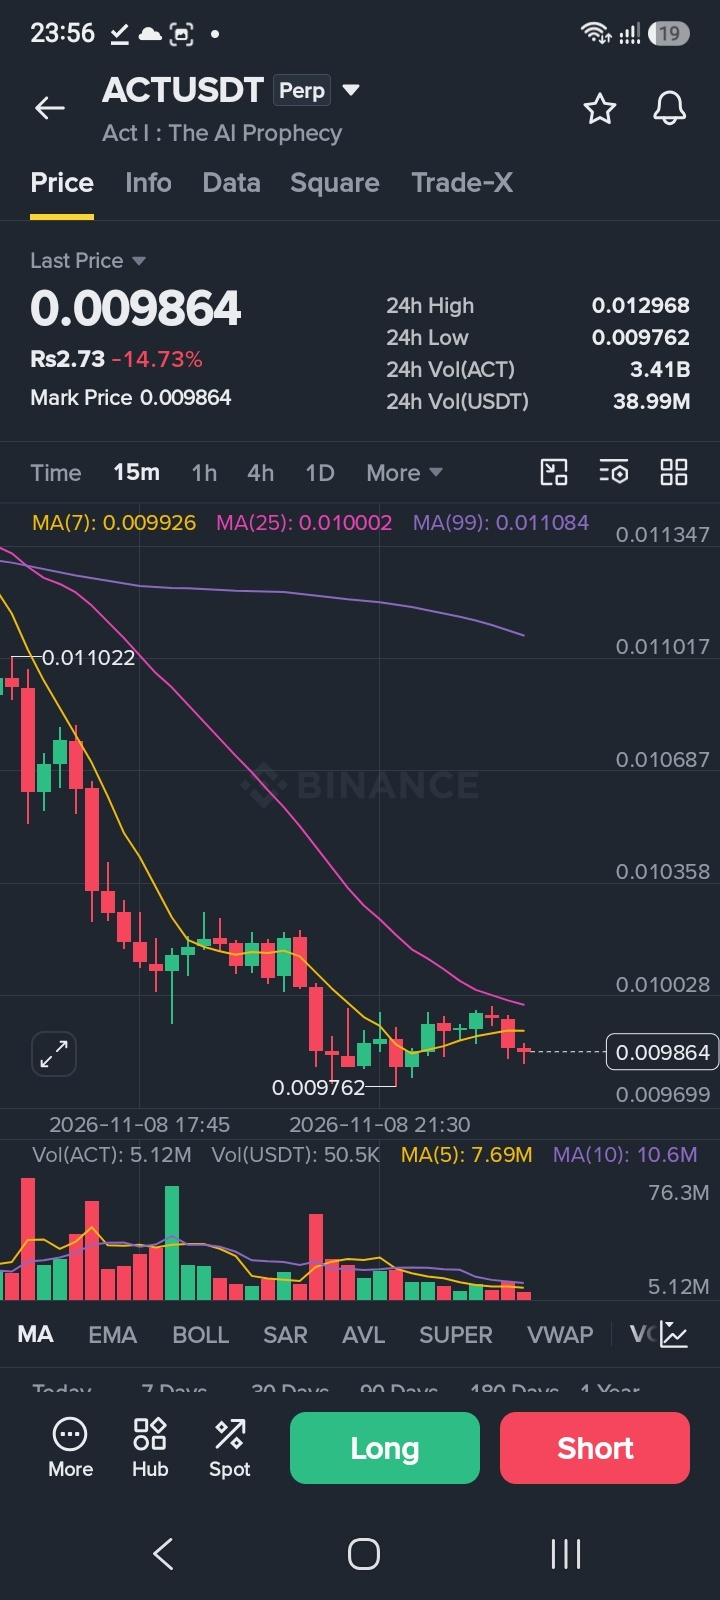
MA(7): 0.009926
MA(25): 0.010002
MA(99): 0.011084
Candle Volume: 5.12M ACT
Volume MA(5): 7.69M
Volume MA(10): 10.6M
The price is trading below all three moving averages, indicating short-term weakness.
Current candle volume is also below both volume averages. This suggests that recent trading activity is relatively weak, and buyers have not yet demonstrated strong recovery momentum.
Key observation: ACT needs to reclaim the $0.009926–$0.010002 area to improve its short-term structure.
2. 1-Hour Chart: Recovery Still Unconfirmed
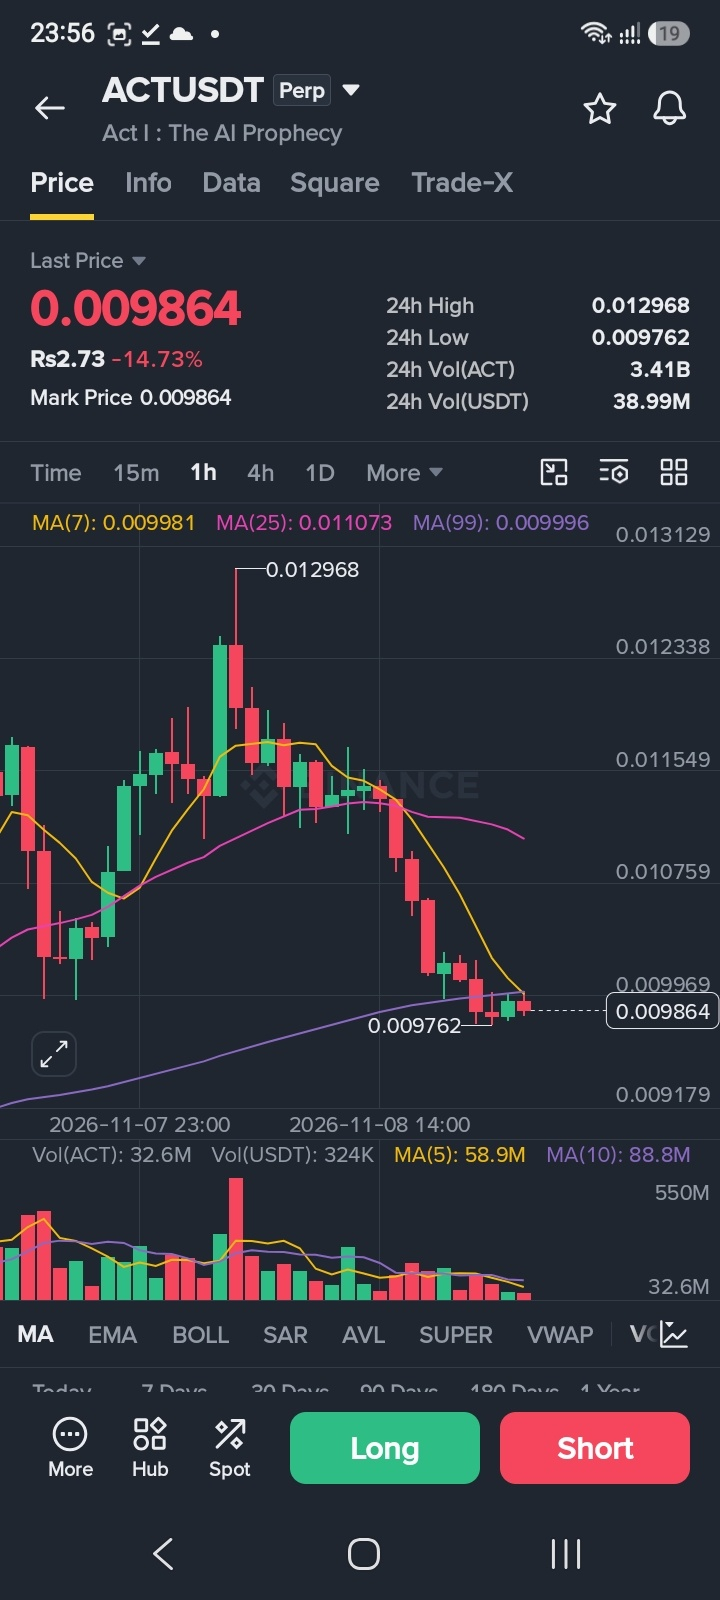
MA(7): 0.009981
MA(25): 0.011073
MA(99): 0.009996
Candle Volume: 32.6M ACT
Volume MA(5): 58.9M
Volume MA(10): 88.8M
The hourly chart also reflects selling pressure. Price remains below the displayed moving averages, while candle volume is significantly lower than both volume averages.
A move above $0.009981–$0.009996 could be an early improvement, but reclaiming the higher $0.011073 level would be a more meaningful development.
Key observation: A recovery needs stronger buying volume, not just a temporary price bounce.
3. 4-Hour Chart: A Critical Middle Ground
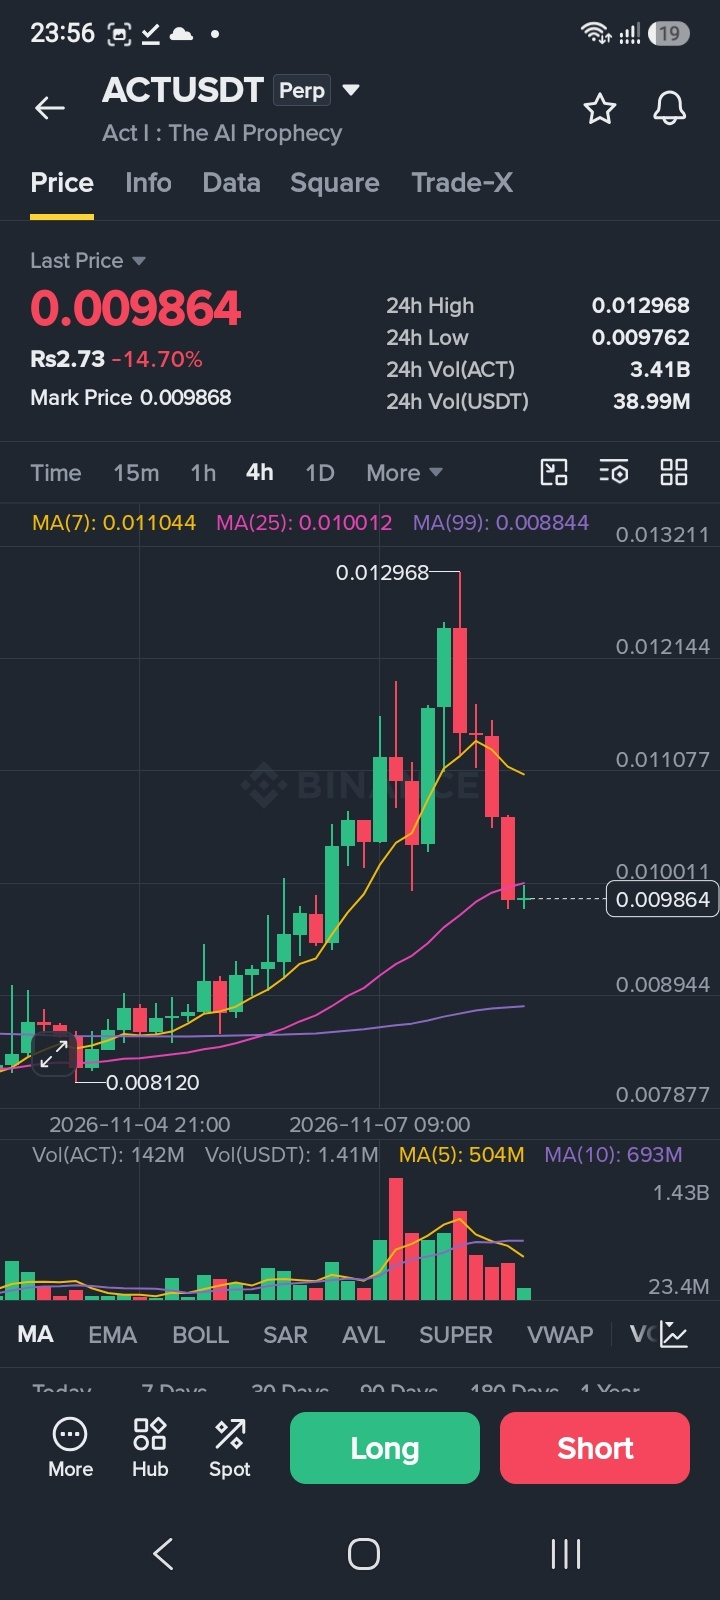
MA(7): 0.011044
MA(25): 0.010012
MA(99): 0.008844
Candle Volume: 142M ACT
Volume MA(5): 504M
Volume MA(10): 693M
The 4-hour structure is mixed. ACT is below MA(7) and MA(25), showing that recent momentum has weakened. However, the price remains above MA(99) at $0.008844.
This longer moving average is an important reference point for the broader 4-hour structure.
Volume is also below both averages, suggesting that buyers have not yet returned with convincing strength.
Key observation: Holding above $0.008844 would help preserve an important support reference on this timeframe.
4. Daily Chart: Is the Bigger Picture Different?
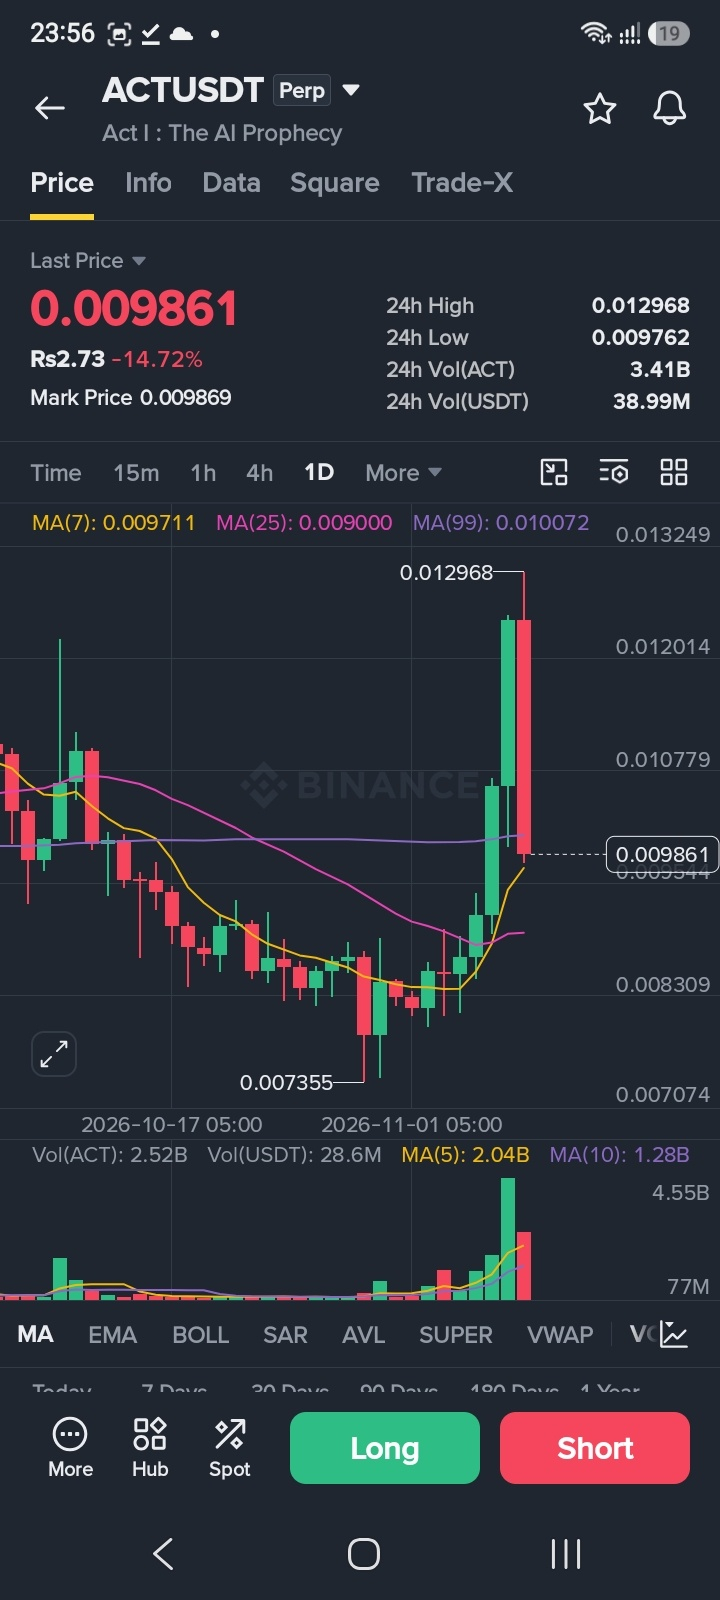
MA(7): 0.009711
MA(25): 0.009000
MA(99): 0.010072
Candle Volume: 2.52B ACT
Volume MA(5): 2.04B
Volume MA(10): 1.28B
The daily chart presents a different picture.
ACT remains above MA(7) and MA(25), which indicates that the broader recovery structure has not completely disappeared. However, it is still below MA(99) at $0.010072.
Daily candle volume is above both volume averages, showing substantial trading activity during the recent move.
The important question is whether this activity represents renewed buying interest or continued distribution. Price action around the moving averages may provide more clarity.
Key observation: A sustained move above $0.010072 would improve the daily structure.
Important Support and Resistance Levels
Support levels
$0.009762 — 24-hour low and immediate support reference
$0.009711 — Daily MA(7)
$0.009000 — Daily MA(25)
$0.008844 — 4-hour MA(99)
Resistance levels
$0.009926–$0.010002 — Immediate recovery zone
$0.010012–$0.010072 — Important moving-average resistance area
$0.011044–$0.011073 — Higher resistance zone
$0.012968 — 24-hour high
What Could Happen Next?
Bullish scenario: If buyers defend $0.009762 and push ACT above $0.01000 with stronger volume, the price could attempt to test the $0.010072 area and then higher resistance.
Bearish scenario: If ACT loses $0.009762 decisively, attention may shift toward $0.009711 and $0.009000. A deeper decline could bring the $0.008844 area into focus.
These are conditional scenarios, not guaranteed price targets.
Final Thoughts
ACT is at an important technical point. The 15-minute and 1-hour charts show clear short-term weakness, while the 4-hour chart remains mixed. The daily chart still holds above MA(7) and MA(25), but MA(99) remains overhead resistance.
For now, the $0.009762 support area and the $0.01000 recovery zone deserve close attention.
What do you think? Can ACT recover above $0.01000, or will sellers push it toward the next support levels?
Share your view below.
Disclaimer: This article is for educational and informational purposes only. It is based on the chart data provided and does not constitute financial advice. Always conduct your own research and manage risk carefully.
#ACT #ACTUSDT #CryptoAnalysis #TechnicalAnalysis #Altcoins #BinancePick