


Impossible Cloud Network (ICNT) is showing impressive strength, gaining approximately 11.11% in 24 hours. But a closer look at all four chart timeframes reveals something important: the broader trend is bullish, while short-term volume still needs confirmation.
At the time of the Binance screenshots on November 8, 2026:
Price: $0.3602
24H Change: +11.11%
24H High: $0.3964
24H Low: $0.3058
24H Volume: 303.59M ICNT
24H Turnover: 107.50M USDT
Let's break down all four timeframes.
1️⃣ 15-MINUTE CHART — SHORT-TERM BUYER CONTROL
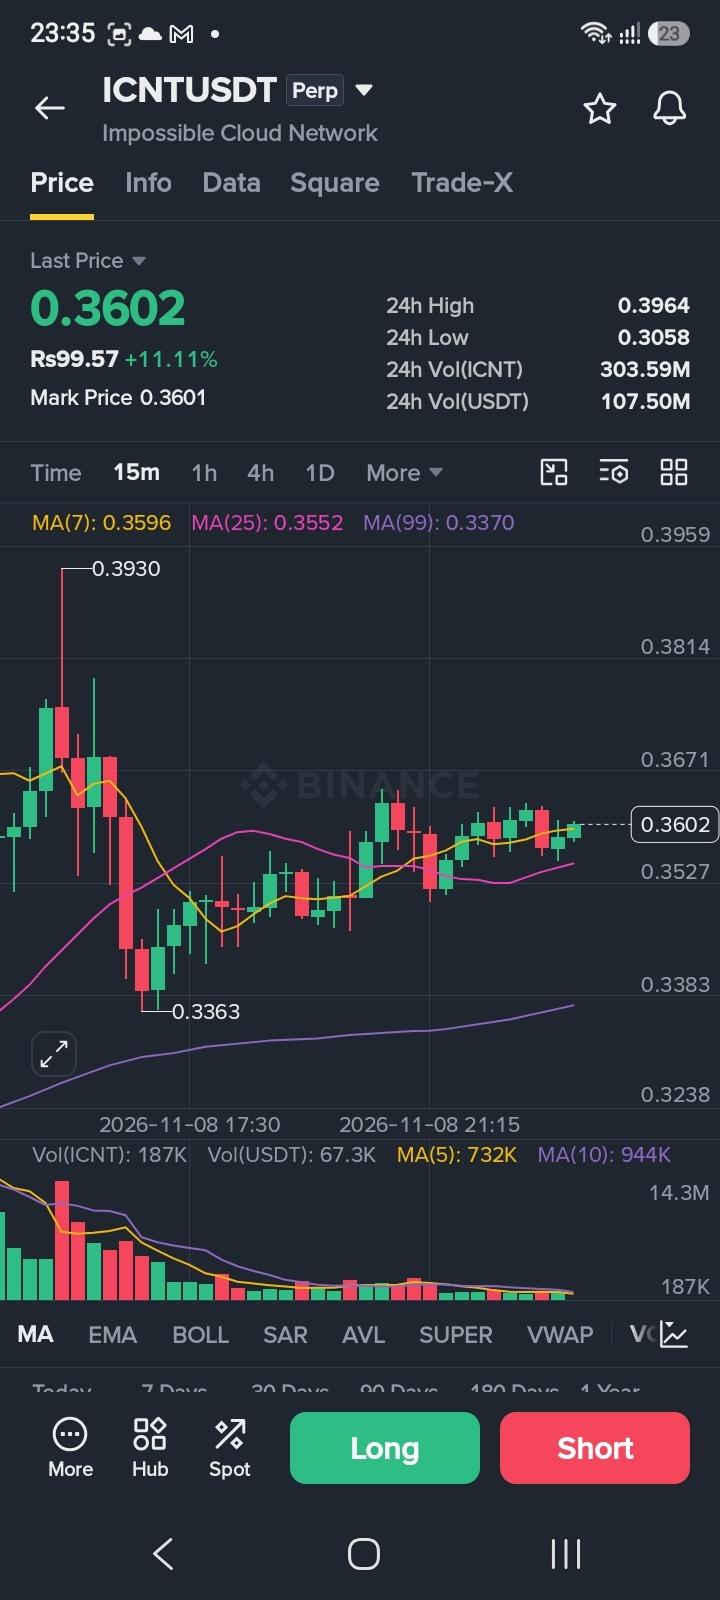
Moving Averages:
MA(7): $0.3596
MA(25): $0.3552
MA(99): $0.3370
ICNT is trading above all three moving averages, indicating a positive short-term structure.
However, the displayed candle volume is only 187K ICNT, compared with MA(5) at 732K and MA(10) at 944K.
Key observation: Buyers are maintaining the short-term structure, but volume is relatively weak. A stronger volume increase would make another upward move more convincing.
2️⃣ 1-HOUR CHART — BULLISH STRUCTURE REMAINS INTACT
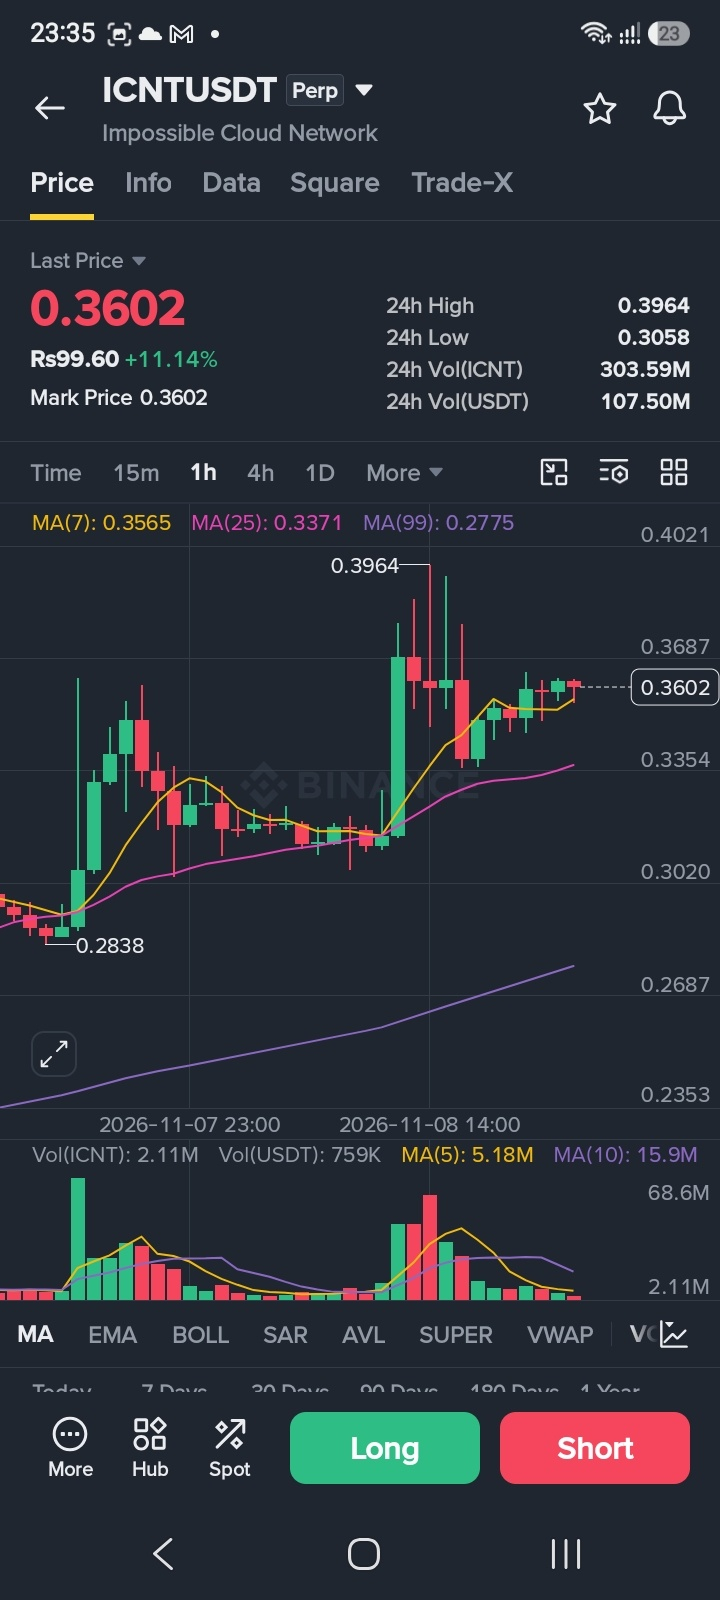
Moving Averages:
MA(7): $0.3565
MA(25): $0.3371
MA(99): $0.2775
Price is above all three moving averages, with MA(7) above MA(25) and MA(99).
The displayed candle volume is 2.11M ICNT, while MA(5) is 5.18M and MA(10) is 15.9M.
Key observation: The hourly trend remains bullish, but the lower candle volume suggests that buyers should demonstrate stronger participation before a fresh breakout is trusted.
3️⃣ 4-HOUR CHART — STRONGER TREND, IMPORTANT CONFIRMATION AHEAD
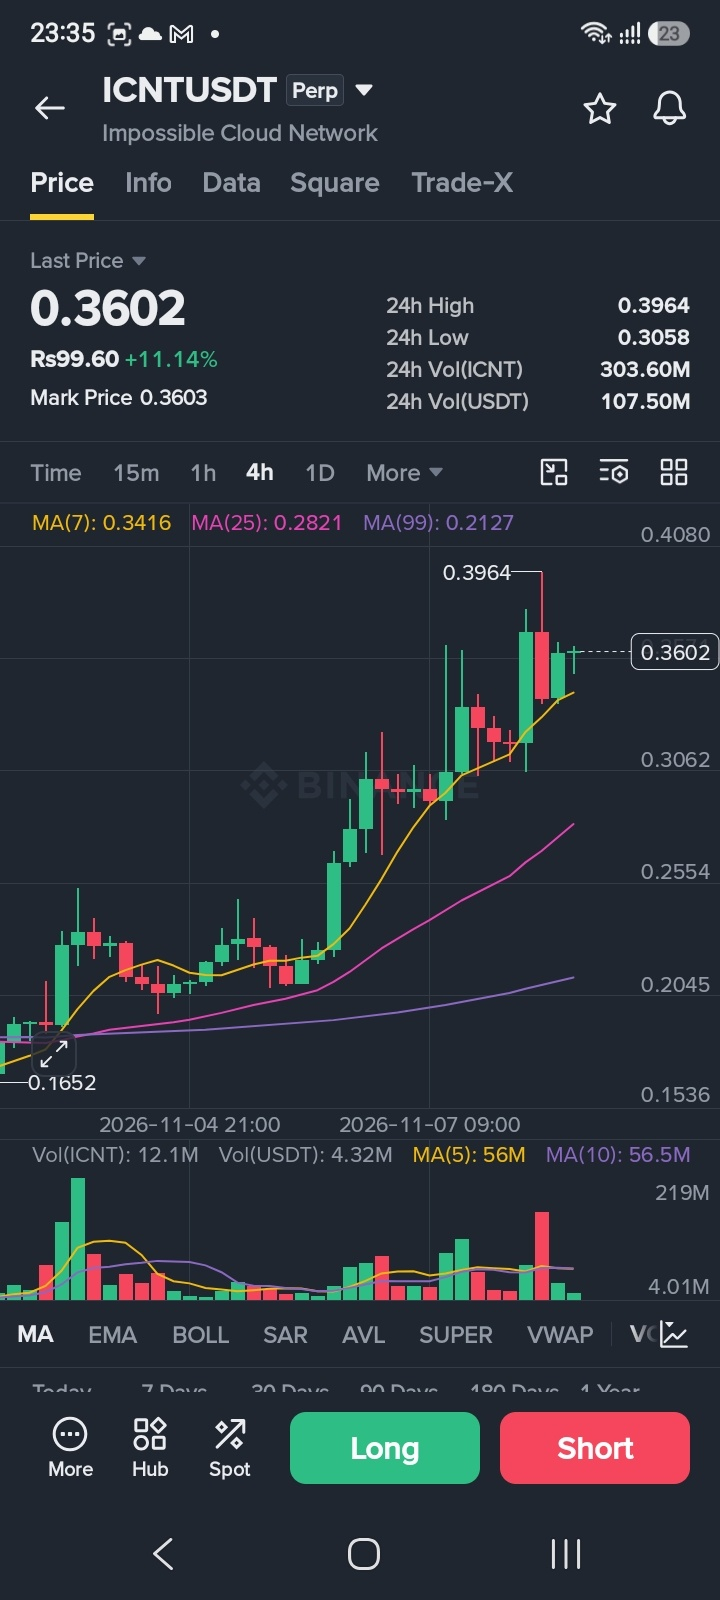
Moving Averages:
MA(7): $0.3416
MA(25): $0.2821
MA(99): $0.2127
The 4H chart shows a strong bullish moving-average arrangement. Price is significantly above all three averages.
Displayed candle volume is 12.1M ICNT, compared with MA(5) at 56M and MA(10) at 56.5M.
Key observation: The broader 4H structure is strong, but the current candle's volume is below its averages. Traders should watch whether new buying activity supports the next move.
4️⃣ DAILY CHART — THE BIGGER BULLISH PICTURE
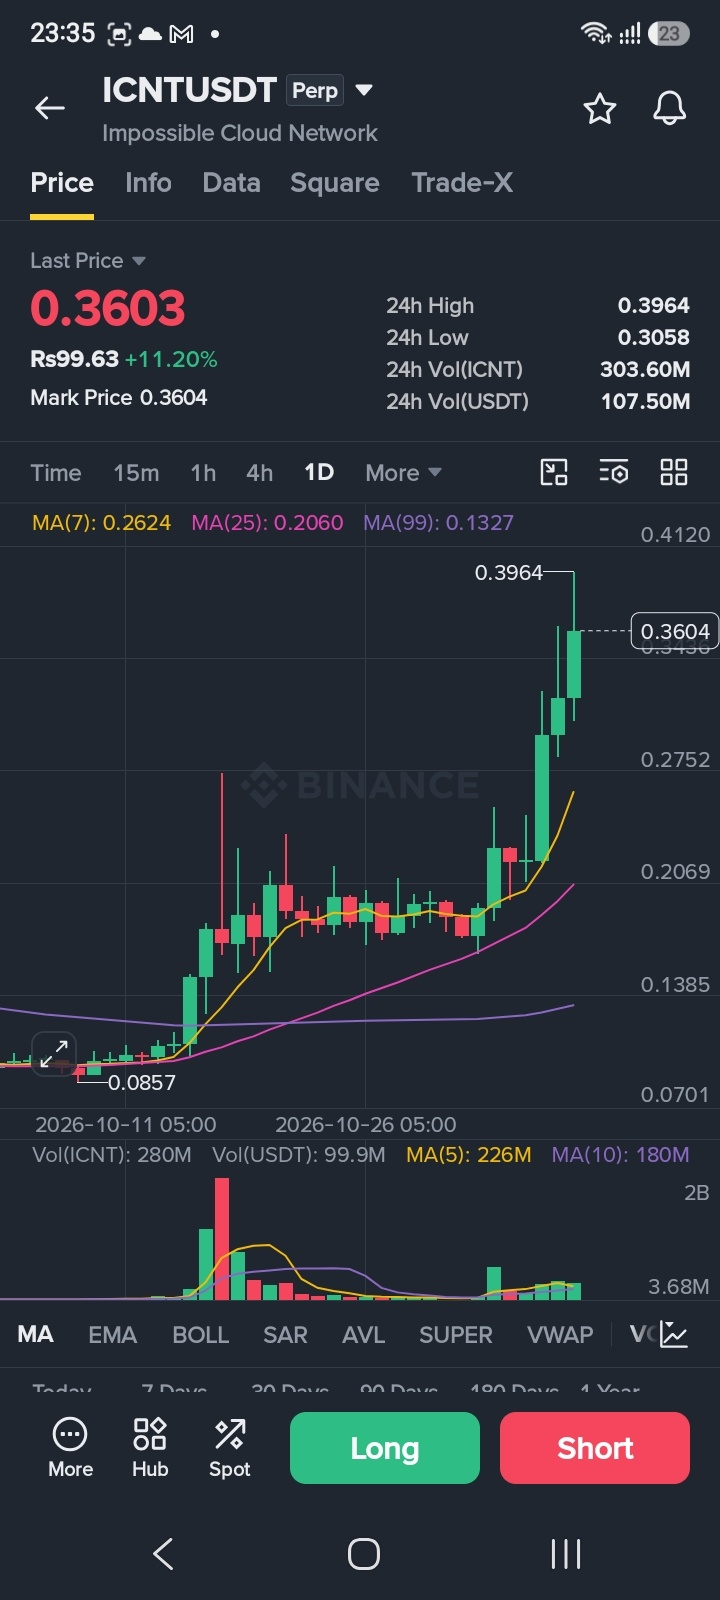
Moving Averages:
MA(7): $0.2624
MA(25): $0.2060
MA(99): $0.1327
The daily chart presents the strongest long-term bullish structure among these four timeframes. Price is trading well above all three moving averages.
Displayed daily candle volume is 280M ICNT, compared with MA(5) at 226M and MA(10) at 180M.
Key observation: Daily volume is above both averages, supporting the broader bullish picture. However, one strong daily snapshot does not guarantee continued upside.
🎯 KEY SUPPORT & RESISTANCE LEVELS
Resistance:
$0.3687 — nearby resistance area
$0.3964 — recent 24H high
$0.4021–$0.4120 — higher resistance zone
Support:
$0.3596–$0.3552 — immediate support
$0.3416–$0.3370 — next support zone
$0.3060–$0.3020 — deeper support area
$0.2821 — important 4H MA(25) reference
🚀 WHAT COULD HAPPEN NEXT?
Bullish scenario: If ICNT holds its immediate support and breaks above $0.3964 with stronger volume and a confirmed candle close, the $0.4021–$0.4120 zone could become the next area to watch.
Bearish scenario: If price loses $0.3552, a pullback toward $0.3416–$0.3370 becomes possible. Further weakness could bring the $0.3060 area into focus.
💬 THE BIG QUESTION
All four timeframes show price above their respective MA(7), MA(25) and MA(99), but short-term volume remains weaker than its averages.
Will ICNT break $0.3964 and continue its rally, or will buyers need a correction before the next move?

Share your analysis in the comments!
Disclaimer: This article is for educational and informational purposes only, not financial advice. All prices, moving averages and volume readings are based on the Binance screenshots provided on November 8, 2026. Cryptocurrency markets are volatile. Always conduct your own research and manage risk.
#ICNT #ImpossibleCloudNetwork #CryptoAnalysis #TechnicalAnalysis #BinancePick