🚀 BNB IS BACK NEAR $700 — IS MOMENTUM SHIFTING?
BNB is showing signs of a short-term recovery after its recent decline.
But what does the 1-hour chart actually tell us? Let's break it down. 👇
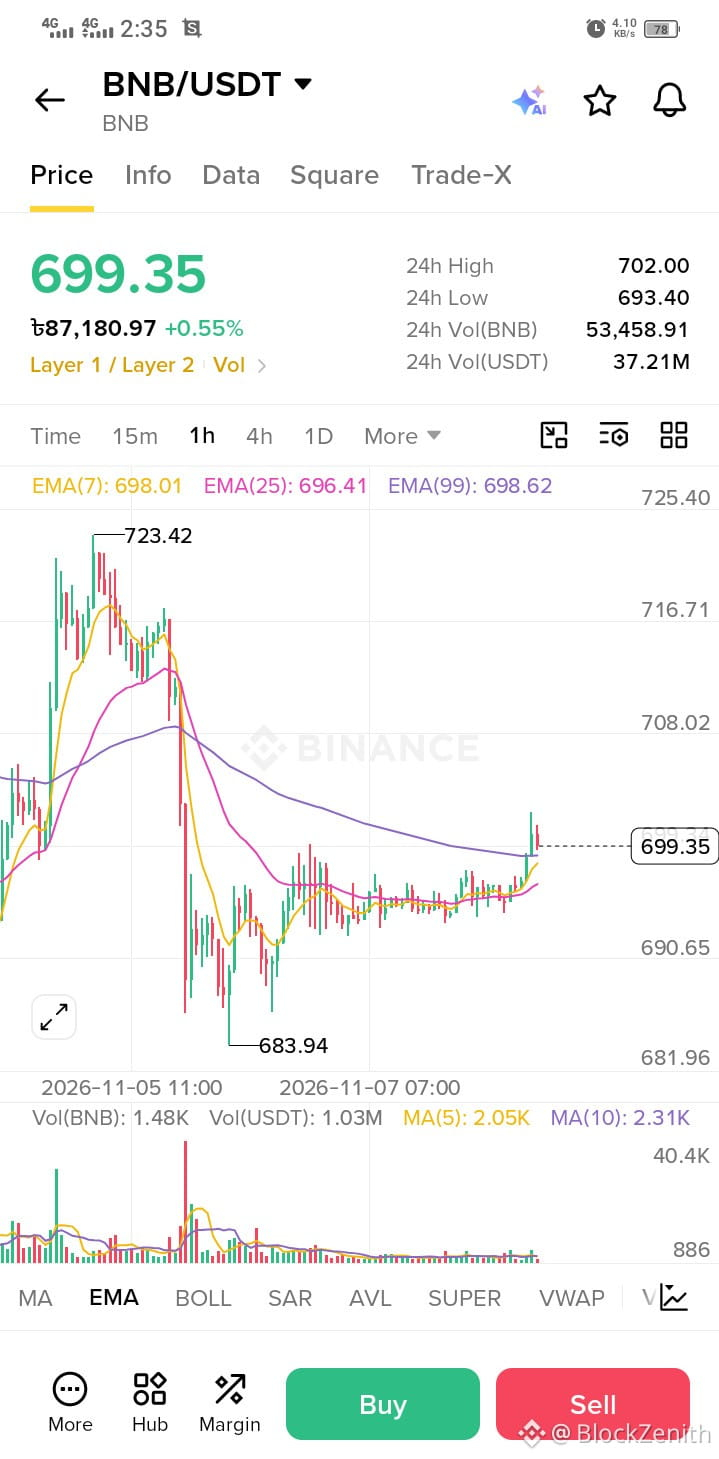
📊 BNB/USDT Market Snapshot
💰 Current Price: $699.35
📈 24H Change: +0.55%
🔺 24H High: $702.00
🔻 24H Low: $693.40
📉 EMA Analysis
🟡 EMA 7: $698.01
💗 EMA 25: $696.41
🟣 EMA 99: $698.62
What I'm Observing:
1️⃣ BNB has recovered from its recent low of $683.94.
2️⃣ The current price is above all three EMAs.
3️⃣ EMA 7 is above EMA 25, suggesting improving short-term momentum.
4️⃣ Price is moving close to the $700 area after a period of consolidation.
5️⃣ Trading volume remains relatively low compared with the earlier high-volume moves.
🧠 The Bigger Picture
BNB is showing signs of recovery, but lower recent volume means the strength of this move still needs confirmation.
One important lesson: A green candle doesn't automatically mean a strong trend reversal.
💬 QUESTION FOR THE COMMUNITY:
What do you think matters more when analyzing BNB — EMA alignment, trading volume, or price action?
Share your thoughts below! 👇
Follow Block Zenith for more educational crypto market analysis.
#BNB #BNBUSDT #CryptoAnalysis #BinanceSquare
$BTC $BNB $ETH
BNB is showing signs of a short-term recovery after its recent decline.
But what does the 1-hour chart actually tell us? Let's break it down. 👇
📊 BNB/USDT Market Snapshot
💰 Current Price: $699.35
📈 24H Change: +0.55%
🔺 24H High: $702.00
🔻 24H Low: $693.40
📉 EMA Analysis
🟡 EMA 7: $698.01
💗 EMA 25: $696.41
🟣 EMA 99: $698.62
What I'm Observing:
1️⃣ BNB has recovered from its recent low of $683.94.
2️⃣ The current price is above all three EMAs.
3️⃣ EMA 7 is above EMA 25, suggesting improving short-term momentum.
4️⃣ Price is moving close to the $700 area after a period of consolidation.
5️⃣ Trading volume remains relatively low compared with the earlier high-volume moves.
🧠 The Bigger Picture
BNB is showing signs of recovery, but lower recent volume means the strength of this move still needs confirmation.
One important lesson: A green candle doesn't automatically mean a strong trend reversal.
💬 QUESTION FOR THE COMMUNITY:
What do you think matters more when analyzing BNB — EMA alignment, trading volume, or price action?
Share your thoughts below! 👇
Follow Block Zenith for more educational crypto market analysis.
#BNB #BNBUSDT #CryptoAnalysis #BinanceSquare
$BTC $BNB $ETH