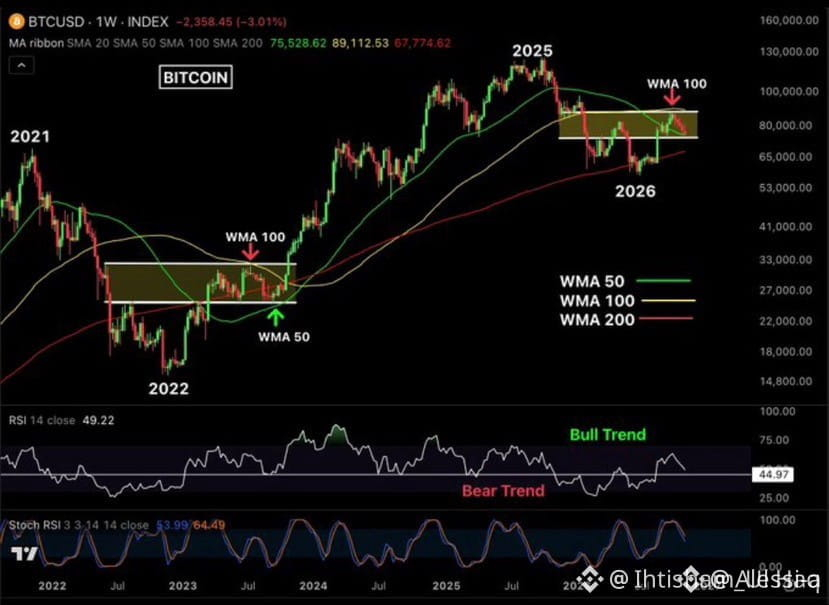
📊 BITCOIN IS SHOWING A FAMILIAR PATTERN ON THE WEEKLY CHART! 👀
A similar setup appeared in 2023, when BTC consolidated between the weekly MA 50 and MA 100 before breaking out into a major rally.
Now, in 2026, Bitcoin is once again trading between these two key moving averages after facing rejection at the weekly MA 100 around $87,400.
🔍 Key Levels I'm Watching:
🟢 Support:
- Weekly MA 50: $75,500
- Weekly MA 200: $67,800
🔴 Resistance:
- $82,000
- Weekly MA 100: $87,400
📉 Momentum Indicators:
- RSI is hovering around 50, still above typical bear-market territory.
- Stochastic RSI remains weak, suggesting further downside could be possible before momentum shifts bullish.
The resemblance to the 2023 setup is certainly worth watching.
If BTC manages to reclaim the weekly MA 100 and sustain a breakout above it, another significant rally could be on the horizon. 🚀
Is history about to repeat itself? 🔥
#Bitcoin #BTC #Crypto #TechnicalAnalysis
A similar setup appeared in 2023, when BTC consolidated between the weekly MA 50 and MA 100 before breaking out into a major rally.
Now, in 2026, Bitcoin is once again trading between these two key moving averages after facing rejection at the weekly MA 100 around $87,400.
🔍 Key Levels I'm Watching:
🟢 Support:
- Weekly MA 50: $75,500
- Weekly MA 200: $67,800
🔴 Resistance:
- $82,000
- Weekly MA 100: $87,400
📉 Momentum Indicators:
- RSI is hovering around 50, still above typical bear-market territory.
- Stochastic RSI remains weak, suggesting further downside could be possible before momentum shifts bullish.
The resemblance to the 2023 setup is certainly worth watching.
If BTC manages to reclaim the weekly MA 100 and sustain a breakout above it, another significant rally could be on the horizon. 🚀
Is history about to repeat itself? 🔥
#Bitcoin #BTC #Crypto #TechnicalAnalysis