

$ETH
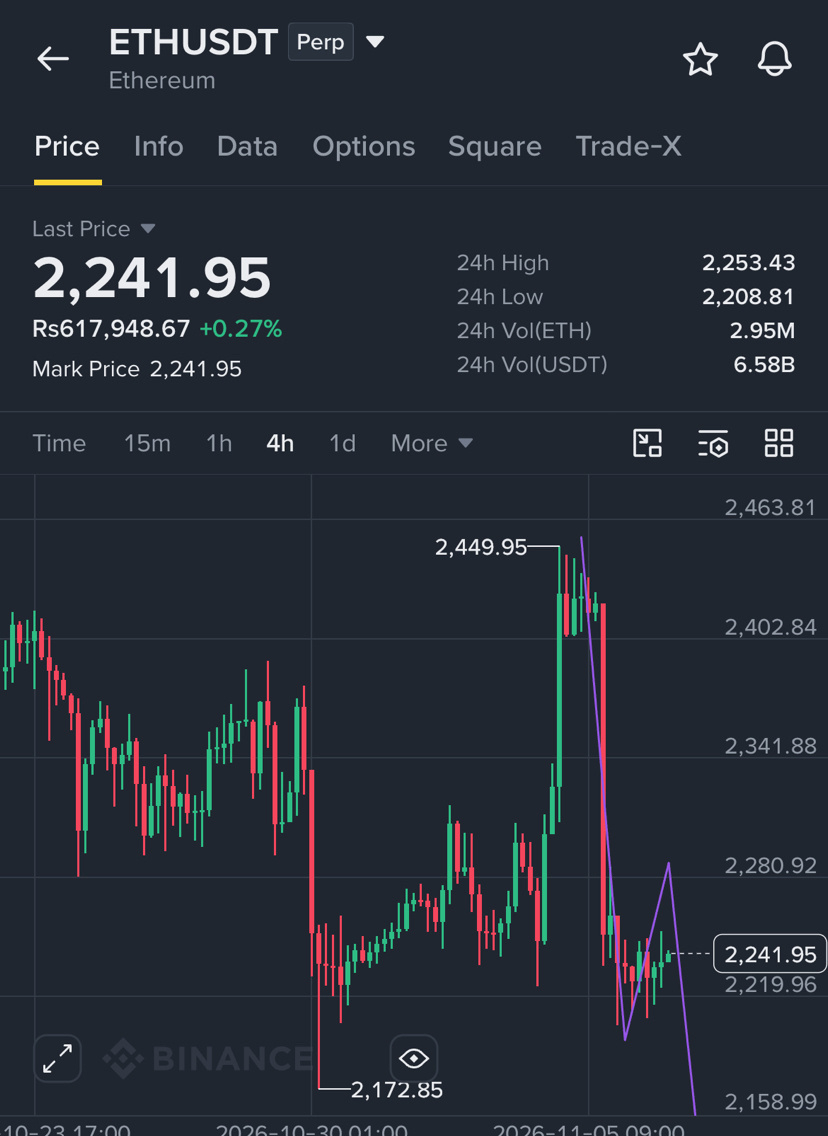
Trading Pair: ETH/USDT Perpetual Futures Asset: Ethereum (ETH) Current price in screenshot: $2,241.95 24-hour change: +0.27% 24-hour high: $2,253.43 24-hour low: $2,208.81
1. Overall market trend
Ethereum is showing signs of weakness on the 4-hour chart.
The price previously surged from approximately $2,172.85 toward $2,449.95. However, this upward move was followed by a strong rejection and a sharp decline.
This indicates that sellers entered the market aggressively near the $2,400–$2,450 region.
Currently, ETH is trading around $2,241.95, attempting to stabilize after the sharp decline. However, the recovery is not yet strong enough to confirm a bullish trend reversal.
2. Important support levels
These are the important price areas visible in your chart:
Support level
Importance
$2,220–$2,208
Immediate support
$2,172.85
Previous major swing low
$2,158.99
Lower chart reference
$2,100
Broader market support reference
Important: If ETH moves below $2,208 and a 4-hour candle closes below this level, selling pressure could increase. The $2,172 area would then become important to watch.
3. Important resistance levels
Resistance level
Importance
$2,253
Immediate resistance
$2,280
Short-term resistance
$2,341
Stronger resistance
$2,402
Major resistance
$2,449.95
Previous major high
ETH needs to recover these resistance areas to demonstrate that buyers are regaining control.
4. Candlestick analysis
The chart shows three important developments:
Strong upward movement: ETH climbed rapidly toward $2,449.95.
Sharp rejection: Sellers pushed the price down aggressively from the upper region.
Weak recovery: The price is now moving around $2,241.95, but the recovery has not yet established a strong upward structure.
This suggests that bearish pressure remains significant.
5. Order book analysis
Your screenshot shows:
Bid: 75.64%
Ask: 24.36%
At the moment of this screenshot, the displayed order book is weighted toward buyers.
However, this does not guarantee that the price will rise. Order-book quantities can change quickly, and large displayed orders may be cancelled.
The actual price movement and trading volume are more useful confirmation.
6. Why is Ethereum under pressure?
Recent market reports dated November 6, 2026, identify several factors:
Weakness in US technology stocks affected cryptocurrency markets.
Approximately $210 million in ETH positions were liquidated over 24 hours.
Around $179 million of those liquidations came from long positions.
US spot Ethereum ETFs experienced nearly $100 million in net outflows on November 5.
These factors contributed to the recent selling pressure. CoinMarketCap +1
7. Bullish and bearish scenarios
Bullish scenario
Recovery possibility
ETH holds the $2,208–$2,220 support region.
Price moves above $2,253.
A stronger recovery above $2,280 could open the way toward $2,341.
A move above $2,341 would improve the bullish structure.
Bearish scenario
Downside risk
ETH fails to hold $2,208.
Selling pressure increases.
The previous low near $2,172.85 becomes an important downside reference.
Further weakness could bring the $2,158 area into focus.
These are conditional technical scenarios, not guaranteed price targets.
8. What does the purple line indicate?
The purple line on your screenshot appears to be a manually drawn projected price path.
It illustrates a possible recovery toward approximately $2,280 followed by another downward move toward the $2,158 region.
However, it is not a confirmed technical indicator or an actual prediction of future prices.
9. Final market assessment
Indicator
Assessment
Short-term trend
Bearish
Buying pressure
Some evidence
Selling pressure
Significant
Immediate support
$2,208
Immediate resistance
$2,253
Major resistance
$2,341
Overall structure
Weak recovery
My conclusion: Ethereum is currently showing a weak recovery after a sharp downward move. The most important area to monitor is $2,208–$2,220. A sustained recovery above $2,253 and $2,280 would improve the technical picture. A confirmed breakdown below $2,208 would increase downside risk.
This is educational chart analysis, not a recommendation to open a leveraged Long or Short position. Perpetual futures can result in rapid losses, particularly when leverage is involved.
One important limitation: This analysis is based on your supplied 4-hour screenshot, not a live Binance chart. The purple projection and order-book figures are snapshot information, not reliable forecasts.

#JobsReportRaisesHikeOdds #BitcoinRebounds$75KAsChipsLead #USNovemberMichiganExpectationsIndexPrelimAt50.9 #US Data Center Rules May Constrain AI Expansion