🚨 Bitcoin is flashing a familiar signal on the weekly chart.
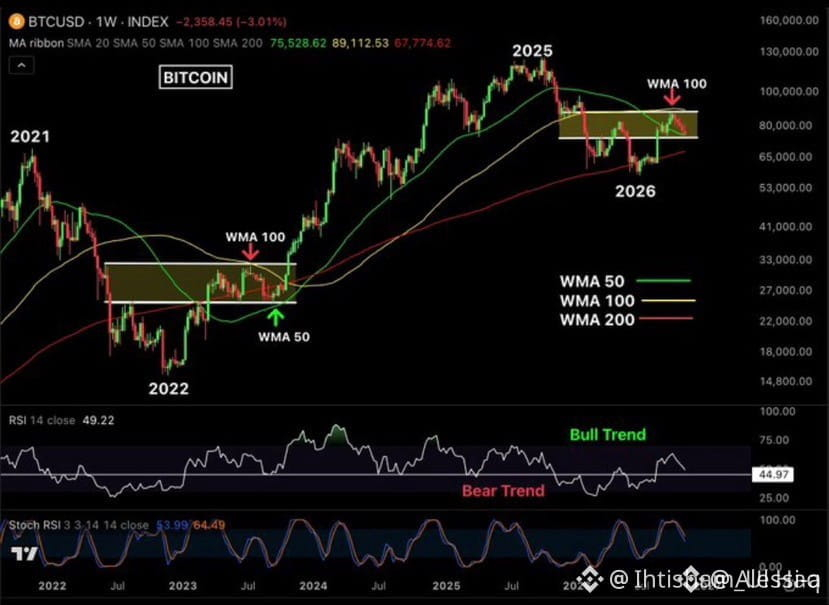
A similar pattern emerged in 2023, when BTC moved sideways between the weekly 50 MA and 100 MA before breaking out and launching its next major rally.
Fast forward to 2026, and Bitcoin appears to be in a similar position. After facing rejection at the weekly 100 MA around $87,400, price is once again consolidating between these two key moving averages.
Here are the key levels I'm monitoring:
🔹 Support: Weekly 50 MA at $75,500, followed by the 200 MA at $67,800.
🔹 Resistance: $82,000, with the weekly 100 MA near $87,400 as the major hurdle.
🔹 RSI: Hovering around 50, still holding above typical bear-market territory.
🔹 Stochastic RSI: Showing weakness, suggesting there may still be room for a pullback, potentially pushing RSI toward 44 before the next upward move.
The resemblance to the 2023 setup is certainly interesting.
If Bitcoin manages to reclaim the weekly 100 MA and establish it as support, another significant bullish move could be on the table.
The key question: Is history about to repeat itself? 👀
A similar pattern emerged in 2023, when BTC moved sideways between the weekly 50 MA and 100 MA before breaking out and launching its next major rally.
Fast forward to 2026, and Bitcoin appears to be in a similar position. After facing rejection at the weekly 100 MA around $87,400, price is once again consolidating between these two key moving averages.
Here are the key levels I'm monitoring:
🔹 Support: Weekly 50 MA at $75,500, followed by the 200 MA at $67,800.
🔹 Resistance: $82,000, with the weekly 100 MA near $87,400 as the major hurdle.
🔹 RSI: Hovering around 50, still holding above typical bear-market territory.
🔹 Stochastic RSI: Showing weakness, suggesting there may still be room for a pullback, potentially pushing RSI toward 44 before the next upward move.
The resemblance to the 2023 setup is certainly interesting.
If Bitcoin manages to reclaim the weekly 100 MA and establish it as support, another significant bullish move could be on the table.
The key question: Is history about to repeat itself? 👀