

Worked for 40s
### $BTC C/USDC – Bitcoin Price Prediction
Strong bearish pressure
### 75,724.23 USDC
24h -1.06%Daily trend bearish
### 1\. Technical analysis – 1D chart
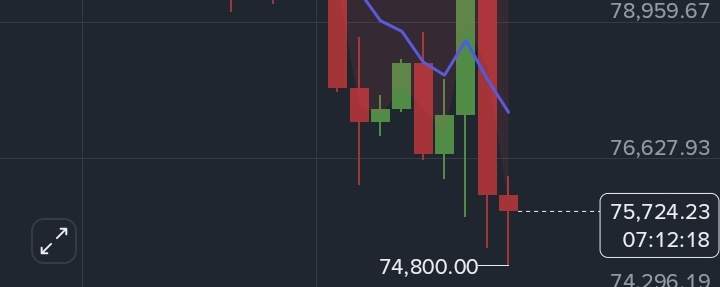
Your Binance screenshot shows strong selling pressure after a failed recovery.
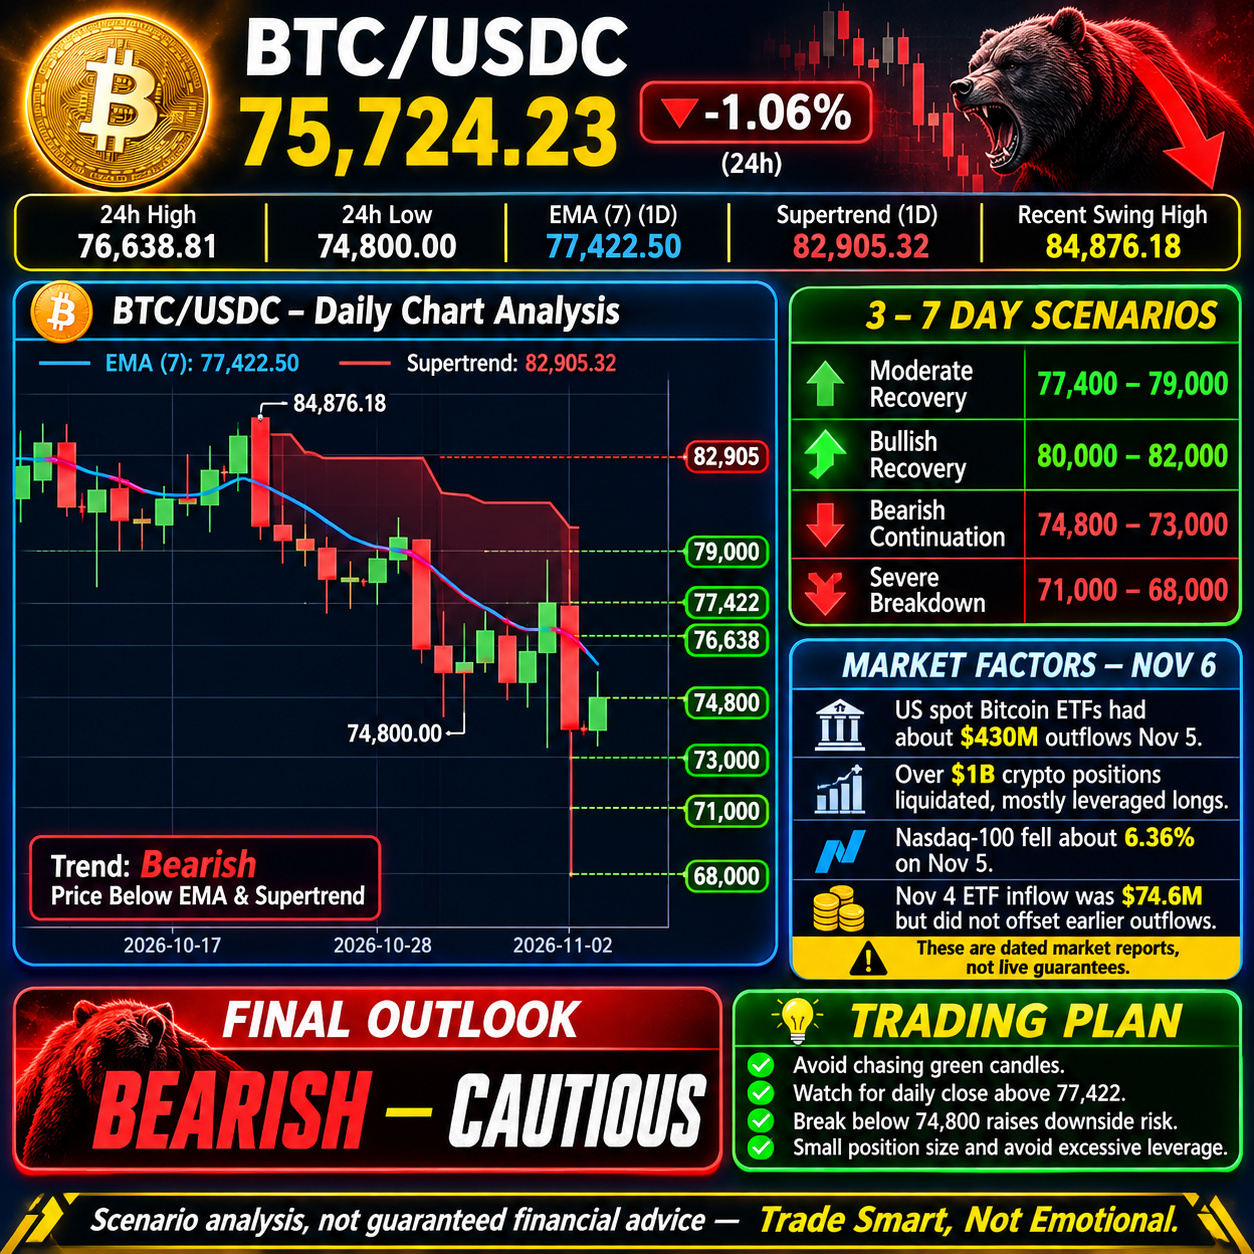
| Indicator | Value | Signal |
| ----------------- | ---------- | ---------------- |
| EMA 7 | $77,422.50 | Bearish |
| Supertrend | $82,905.32 | Strong bearish |
| 24h high | $76,638.81 | Resistance |
| 24h low | $74,800 | Support |
| Recent swing high | $84,876.18 | Major resistance |
My observation: BTC is trading below EMA 7 and Supertrend. Sellers currently have control. The $74,800 level is particularly important.
### 2\. International market and financial activity
Latest November 6 market reporting adds several bearish warning signs:
* ETF outflows: US spot Bitcoin ETFs recorded approximately $430 million in outflows on November 5. Decrypt
* Liquidations: More than $1 billion in crypto positions were liquidated during the selloff, predominantly leveraged long positions. CoinDesk +1
* Stock market: The Nasdaq-100 fell approximately 6.36% in the November 5 session, putting pressure on risk assets. Investing.com
* Institutional demand: There was a $74.6 million ETF inflow on November 4, but it did not offset the preceding outflows. Goodman Macro
* Geopolitical situation: Risk sentiment remains sensitive to geopolitical developments, but these market movements do not establish that war developments caused the BTC selloff.
My conclusion: The immediate market environment favors caution rather than aggressive buying.
### 3\. BTC price prediction – next 3–7 days
| Scenario | BTC target |
| ----------------------- | --------------- |
| Strong bullish recovery | $80,000–$82,000 |
| Moderate recovery | $77,400–$79,000 |
| Bearish continuation | $74,800–$73,000 |
| Severe breakdown | $71,000–$68,000 |
These are scenario-based estimates, not guaranteed targets.
### 4\. Trading strategy
Resistance
Upside levels
* $76,638
* $77,422
* $79,000
* $82,905
Support
Downside levels
* $74,800
* $73,000
* $71,000
* $68,000
My preferred approach:
* Avoid chasing a green candle.
* Watch for a daily close above $77,422.
* A break below $74,800 increases downside risk.
* Use small position sizes and avoid excessive leverage.
BTC Analysis Image CreatedFinal outlook: Bearish – Cautious
My key prediction: $74,800 is
critical support. A recovery above $77,422 would be the first meaningful bullish signal.
#AnthropicIPOValuationDoubts #JobsReportRaisesHikeOdds #OilPlungesBelow$100 $BTC
