$BMT USDT Perp The Rally Is Strong, But Chasing It Here Is the Risk
Bubblemaps is trading near 0.02768, up 33.27% over 24 hours. That is a serious move, but the more useful detail is the participation behind it: reported turnover has reached 92.59M USDT, with 3.68B BMT traded. This does not look like a move driven by one isolated, low-liquidity wick. Still, high turnover confirms activity, not the direction of the next candle.
What the chart says
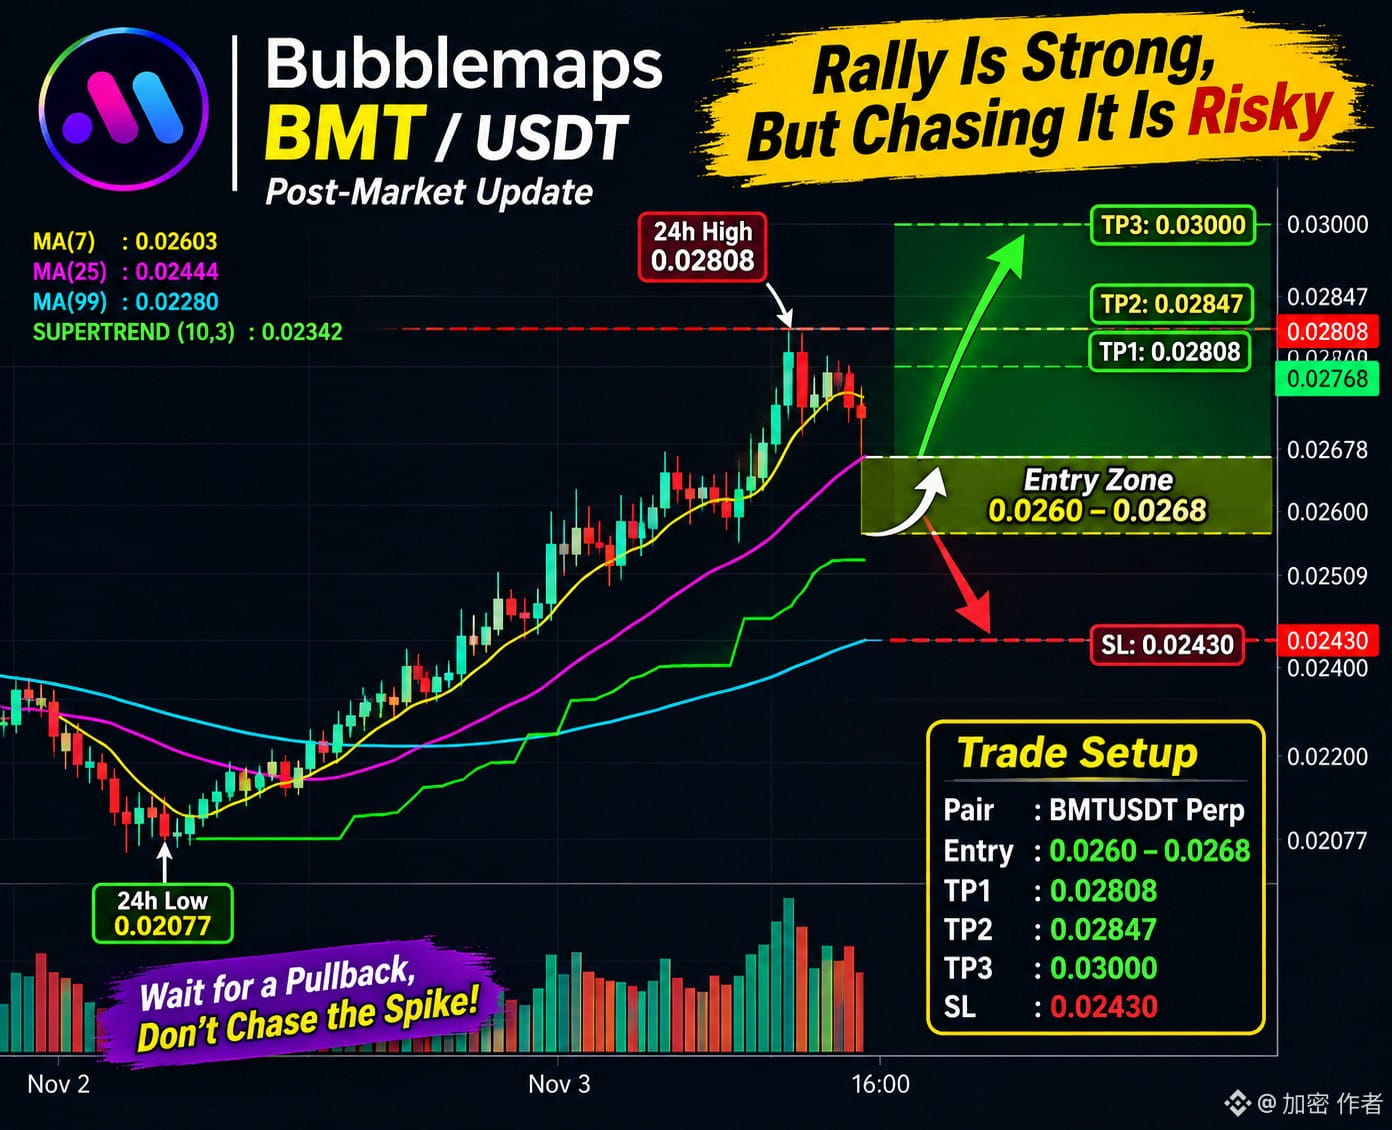
Price has pushed from the 24-hour low at 0.02077 toward 0.02808 and is holding above all three visible moving averages: MA(7) at 0.02603, MA(25) at 0.02444 and MA(99) at 0.02280. The Supertrend is lower at 0.02342, so the broader short-term structure remains bullish. The catch is distance: after a 33% daily expansion, late buyers could be exposed if momentum cools.
My read
I would rather see BMT retest the 0.0260–0.0268 area and hold it than buy directly beneath the 0.02808 high. A clean reclaim and sustained trade above 0.02808 would improve the breakout case. Failure to defend the entry zone, especially a move below 0.02509, would warn that the rally is losing control. There is no confirmed catalyst in the supplied chart data, so I would not invent one; volume and trend alignment explain participation, not the underlying news.
Conditional setup — not an executed trade
Pair: BMTUSDT Perpetual
Entry zone: 0.0260–0.0268
TP1: 0.02808
TP2: 0.02847
TP3: 0.03000
Stop-loss: 0.02430
The setup only makes sense if price respects the pullback zone. If it runs without a retest, I would let it go rather than turn FOMO into a position. A close below the stop area invalidates this idea; position size should reflect the volatility.
The key question now: can buyers absorb profit-taking near 0.0280, or does #BMT need a deeper reset before another leg?
Bubblemaps is trading near 0.02768, up 33.27% over 24 hours. That is a serious move, but the more useful detail is the participation behind it: reported turnover has reached 92.59M USDT, with 3.68B BMT traded. This does not look like a move driven by one isolated, low-liquidity wick. Still, high turnover confirms activity, not the direction of the next candle.
What the chart says
Price has pushed from the 24-hour low at 0.02077 toward 0.02808 and is holding above all three visible moving averages: MA(7) at 0.02603, MA(25) at 0.02444 and MA(99) at 0.02280. The Supertrend is lower at 0.02342, so the broader short-term structure remains bullish. The catch is distance: after a 33% daily expansion, late buyers could be exposed if momentum cools.
My read
I would rather see BMT retest the 0.0260–0.0268 area and hold it than buy directly beneath the 0.02808 high. A clean reclaim and sustained trade above 0.02808 would improve the breakout case. Failure to defend the entry zone, especially a move below 0.02509, would warn that the rally is losing control. There is no confirmed catalyst in the supplied chart data, so I would not invent one; volume and trend alignment explain participation, not the underlying news.
Conditional setup — not an executed trade
Pair: BMTUSDT Perpetual
Entry zone: 0.0260–0.0268
TP1: 0.02808
TP2: 0.02847
TP3: 0.03000
Stop-loss: 0.02430
The setup only makes sense if price respects the pullback zone. If it runs without a retest, I would let it go rather than turn FOMO into a position. A close below the stop area invalidates this idea; position size should reflect the volatility.
The key question now: can buyers absorb profit-taking near 0.0280, or does #BMT need a deeper reset before another leg?