

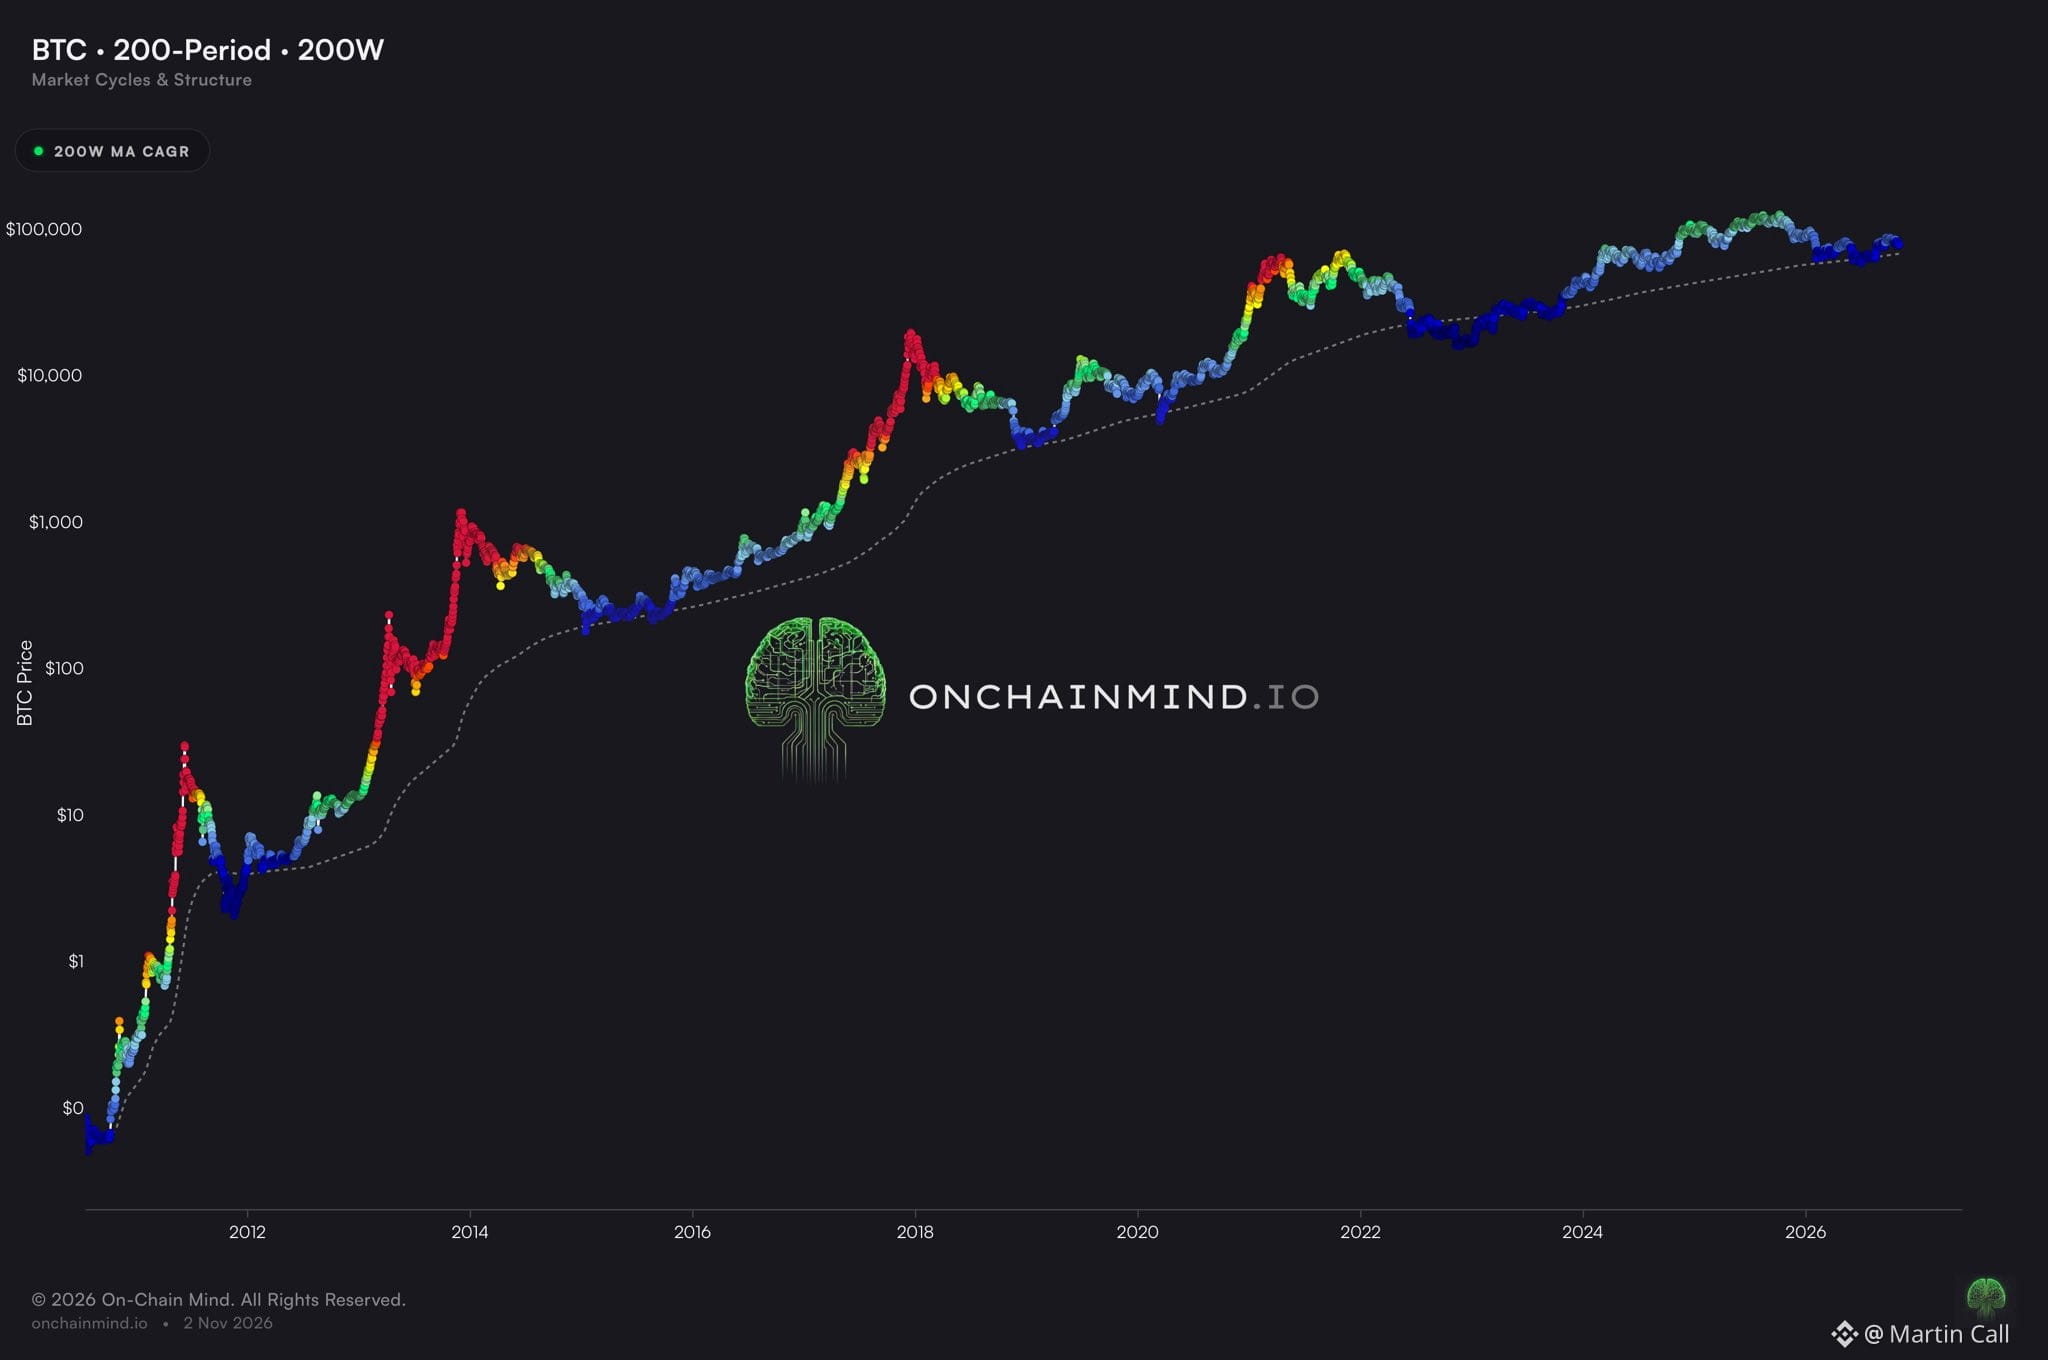
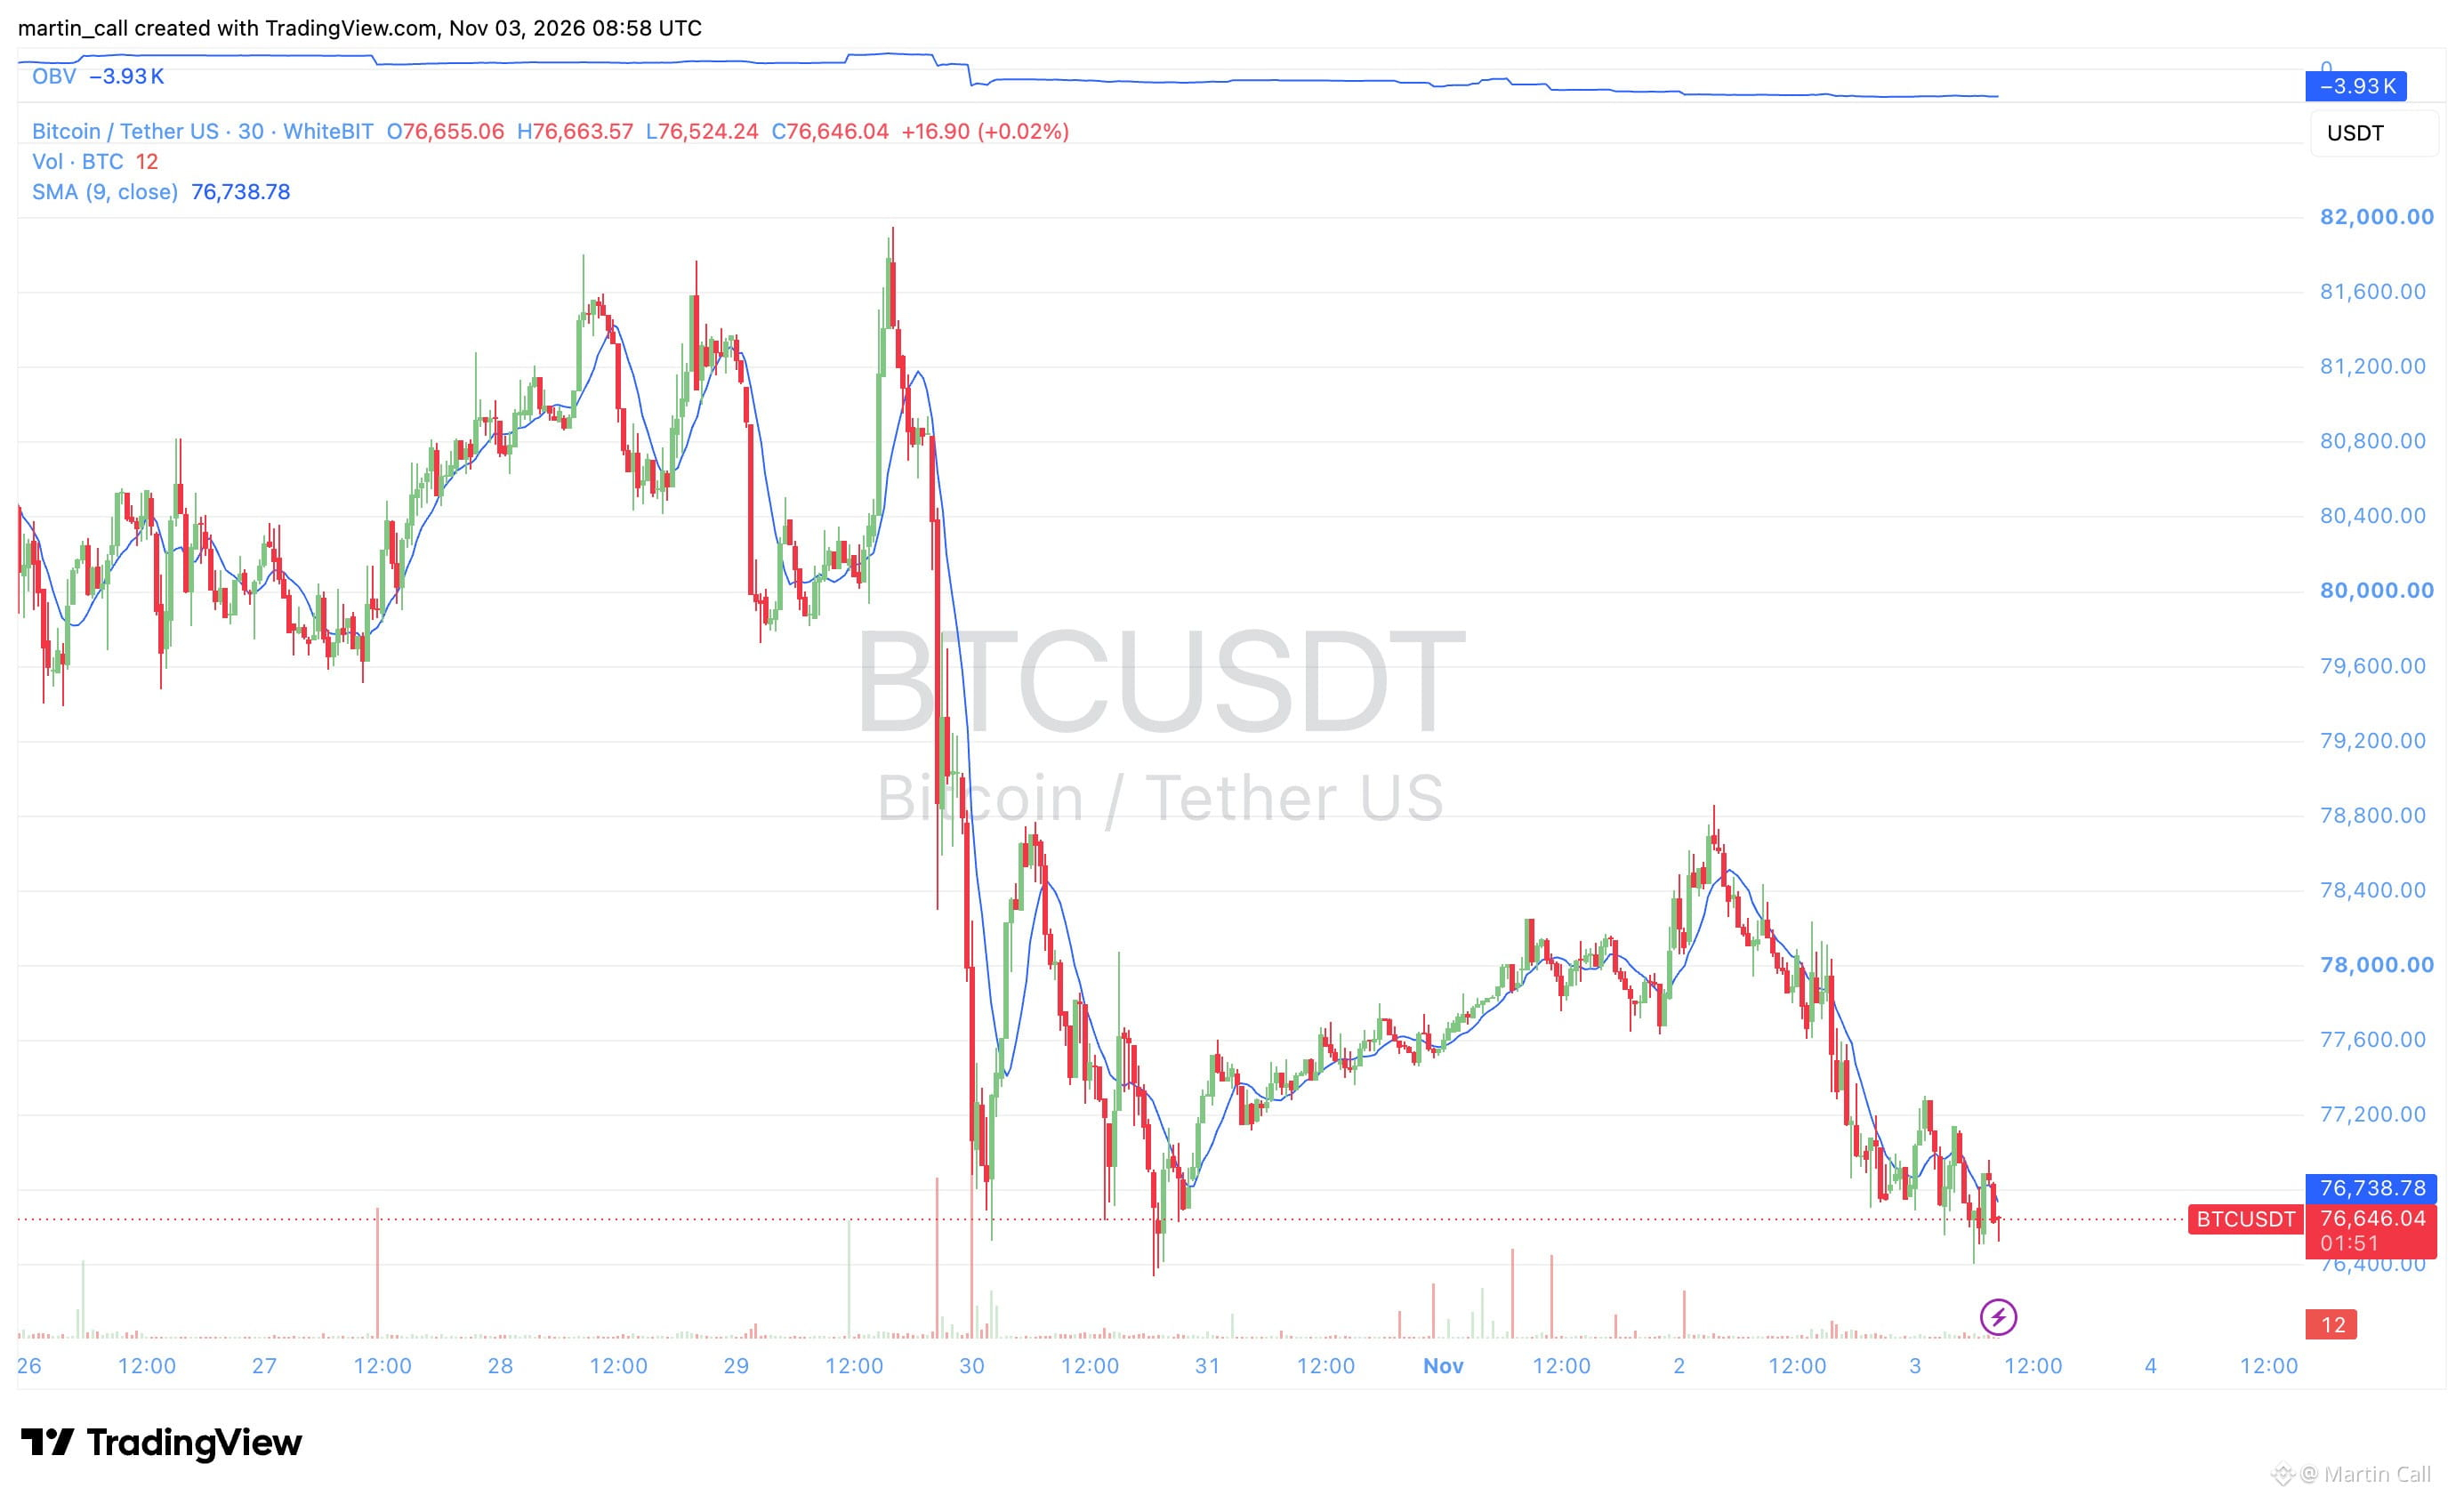
👀 $BTC ’s Long-Term “Floor” Could Hit $167K by 2030 If This Pace Holds My 30-minute chart says $BTC lost about $5K this week, from almost $82K to around $76.6K. The 200-week moving average didn’t even notice 😅 That line is the average price over almost four years, and it’s been rising at roughly 30% a year. If that pace continues, the math looks like this: 🔹 around $167K by 2030 🔹 around $534K by 2035 $BTC has traded above this line for most of its history. That’s why traders often call it Bitcoin’s long-term floor. To be fair, a moving average follows price, it doesn’t predict it. So I wouldn’t treat $534K as a target. What I like is the direction: even after a rough week, the floor keeps moving up. Key levels on my chart 👇 📈 Resistance: $78.8K. Price got rejected there on October 30 and again on November 2. 📌 Support: $76.4K, tested on October 30 and again this morning. 📉 If that gives way, $76K is the next round number. Which one do you check more often, the 30-minute chart or the 200-week line? 🤔 Not financial advice. DYOR. #BTC Price Analysis# #Macro Insights# #BTC, is the correction enough?# #BTC Above 60K#
Rejoignez la communauté mondiale des adeptes de cryptomonnaies sur Binance Square
⚡️ Suviez les dernières informations importantes sur les cryptomonnaies.
💬 Jugé digne de confiance par la plus grande plateforme d’échange de cryptomonnaies au monde.
👍 Découvrez les connaissances que partagent les créateurs vérifiés.
Adresse e-mail/Nº de téléphone