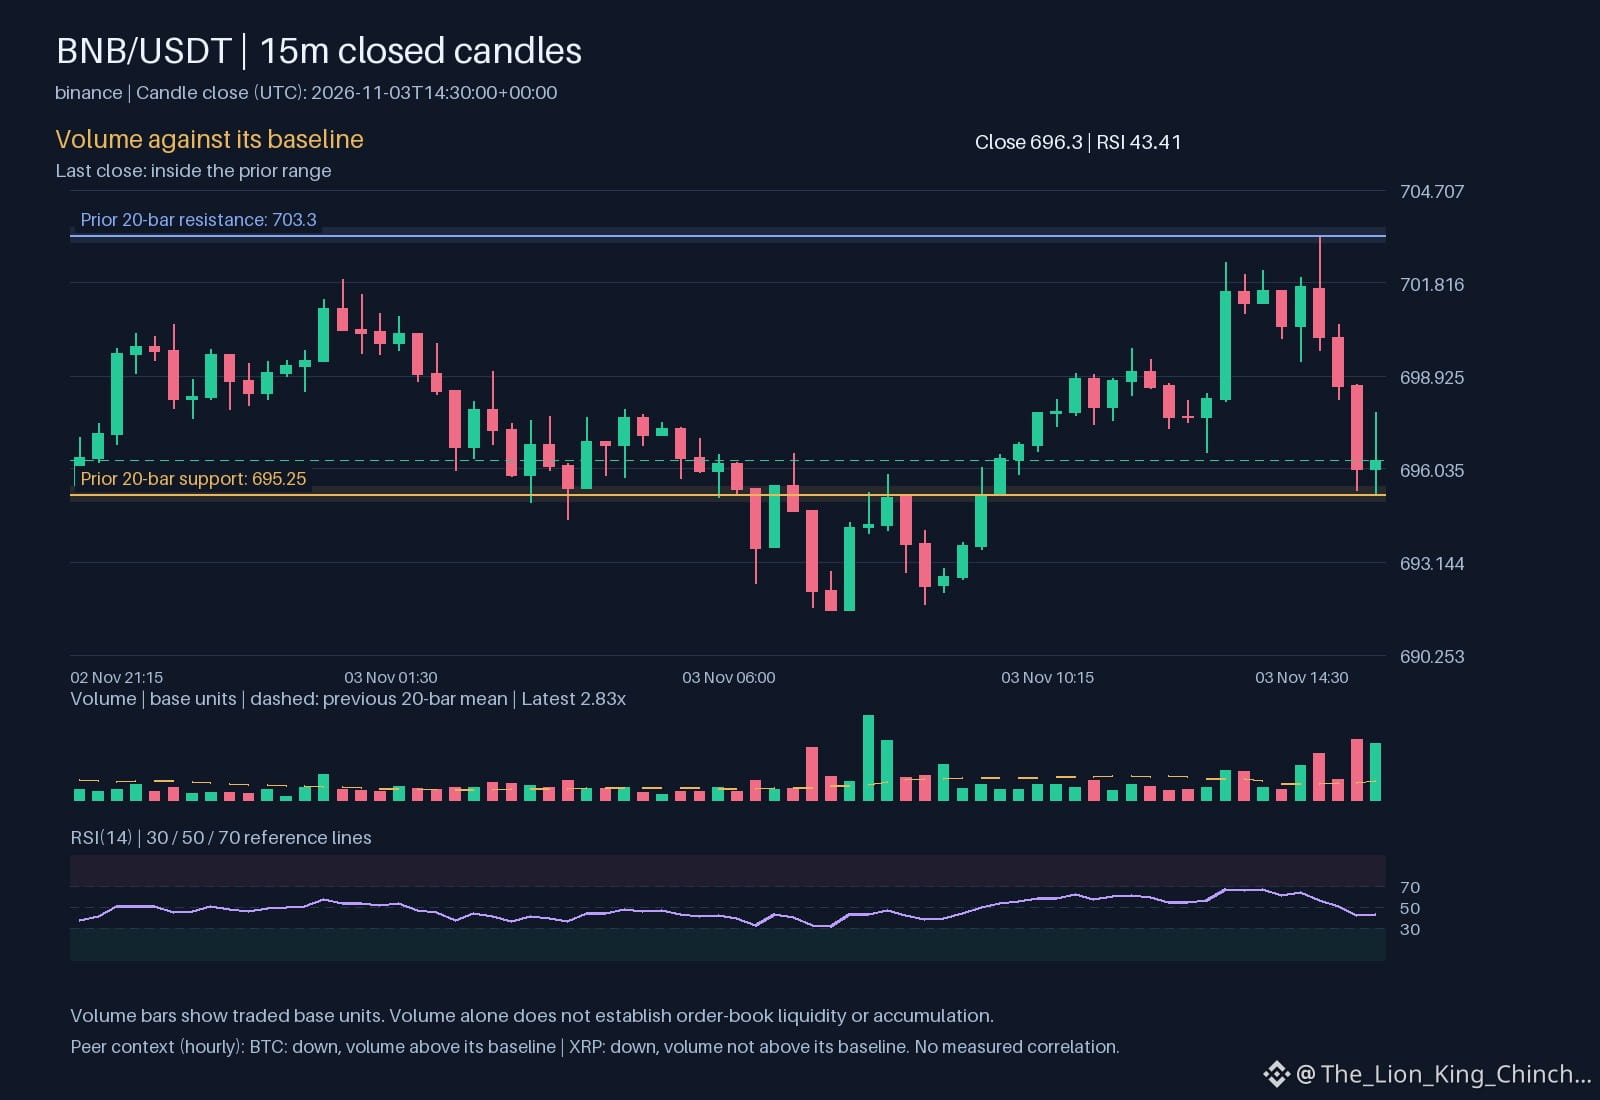
$BNB: BNB Volume Check: How Does the Hourly Move Hold?
The primary question for $BNB is whether the hourly down move is supported by the strong volume signal. On the same exchange, $BNB shows an hourly direction down and volume above baseline, matching the observation for $BTC . However, $XRP also moves down while its volume stays near the baseline, highlighting a key difference.
The shared direction does not imply a common driver. Instead, the strength of the move depends on how long the volume remains elevated. When volume stays above baseline for several hours, price pressure is more likely to persist, because market participants are actively selling or buying at the current level. If volume reverts to normal quickly, the down move may lose momentum and reverse.
A simple way to reassess is to monitor the relative volume metric each hour. If 2.83013 stays above one, the down trend for $BNB gains credibility. If it drops back toward one, the trend may be fragile.
Thus, direction alone tells only part of the story; the durability of the move, measured by sustained volume, matters more in this comparison.
Probabilistic market research, not a recommendation or guaranteed return.
The comparison to keep in mind: $BTC has hourly direction down and volume above its baseline; $XRP has hourly direction down and volume not above its baseline. This alone does not establish correlation.
Which matters more in this comparison: direction or how the move holds?
#BNB #BTC #XRP #CryptoWatchlist #CryptoLearning
Binance spot proof for $BNB: closed price 696.3 USDT.
Source: binance. Closed candle: 2026-11-03T14:30:00+00:00.
The primary question for $BNB is whether the hourly down move is supported by the strong volume signal. On the same exchange, $BNB shows an hourly direction down and volume above baseline, matching the observation for $BTC . However, $XRP also moves down while its volume stays near the baseline, highlighting a key difference.
The shared direction does not imply a common driver. Instead, the strength of the move depends on how long the volume remains elevated. When volume stays above baseline for several hours, price pressure is more likely to persist, because market participants are actively selling or buying at the current level. If volume reverts to normal quickly, the down move may lose momentum and reverse.
A simple way to reassess is to monitor the relative volume metric each hour. If 2.83013 stays above one, the down trend for $BNB gains credibility. If it drops back toward one, the trend may be fragile.
Thus, direction alone tells only part of the story; the durability of the move, measured by sustained volume, matters more in this comparison.
Probabilistic market research, not a recommendation or guaranteed return.
The comparison to keep in mind: $BTC has hourly direction down and volume above its baseline; $XRP has hourly direction down and volume not above its baseline. This alone does not establish correlation.
Which matters more in this comparison: direction or how the move holds?
#BNB #BTC #XRP #CryptoWatchlist #CryptoLearning
Binance spot proof for $BNB: closed price 696.3 USDT.
Source: binance. Closed candle: 2026-11-03T14:30:00+00:00.