

'Funding rate tells you which side of a perpetual is paying to stay in. Open interest tells you whether positions are being added or closed. Read alone, each one is easy to misread: high funding can sit there for days, and rising open interest says nothing about direction. Funding Compass puts both on one pane, across Binance, Bybit, OKX and Bitget, so you can read them together.
1) START WITH THE COLUMNS
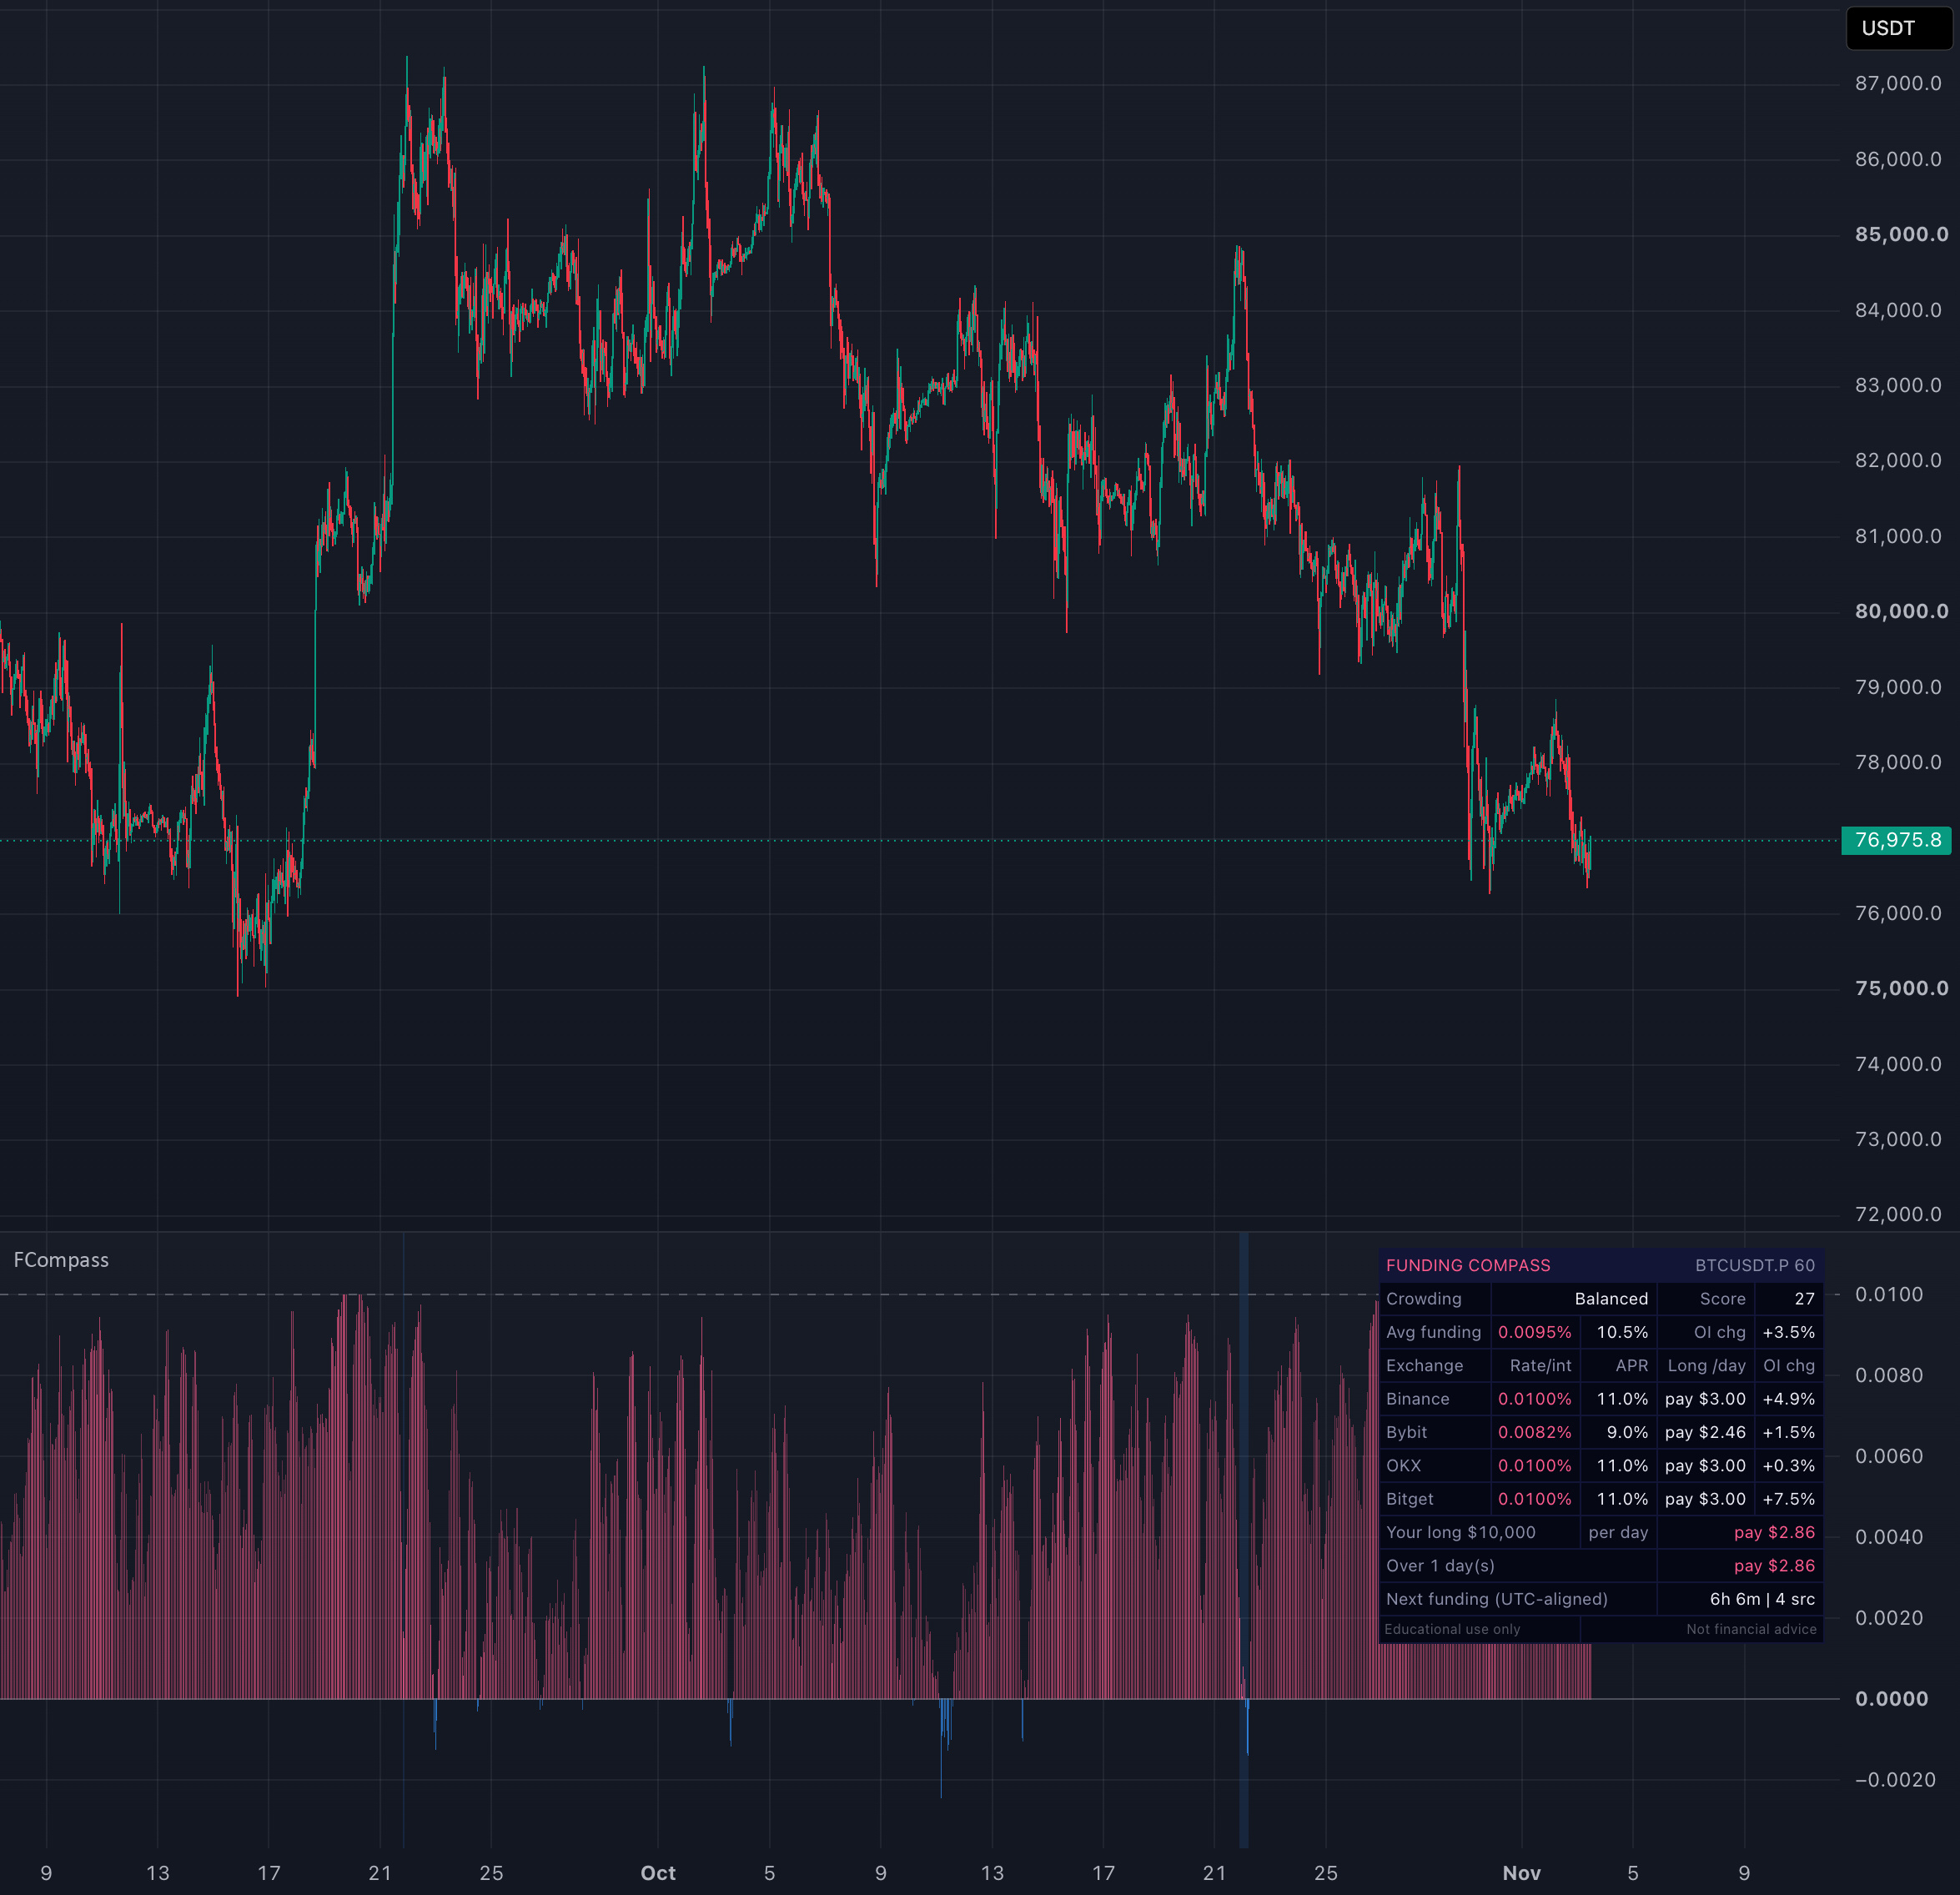
The columns show the average funding rate per interval across the exchanges that return data. Pink means positive funding (longs pay shorts), blue means negative funding (shorts pay longs). The dashed line marks 0.01% per interval, a common default level. Columns far above it mean longs are paying well above the usual rate; columns below zero mean shorts are paying.
2) ADD OPEN INTEREST
The dashboard shows the open interest change for each exchange and on average. Exchanges report open interest in different units, so it is compared as a percentage change only. Funding rising while open interest also rises means new positions are being opened on the side that is paying. Funding high while open interest falls means positions are closing even though one side is still paying.
3) READ THE CROWDING STATE
The crowding row combines the two into one of five states: Longs crowded, Leaning long, Balanced, Leaning short, Shorts crowded. It compares funding with this market's own recent history and adds weight when open interest is growing, so long periods of flat funding do not push it up. The column opacity follows the score. It describes positioning right now, not what price does next.
4) CHECK THE PER-EXCHANGE TABLE
One exchange can drift away from the others. The table lists the rate per interval, the annualized rate and the open interest change for each exchange, so a reading driven by a single venue stands out.
5) SEE WHAT IT COSTS YOUR POSITION
Enter your side, position size and holding period. The dashboard shows what that position pays or receives in funding per day and over the holding period, and counts down to the next funding time. Set the funding interval to match your contract (8h, 4h or 1h).
A QUICK CHECKLIST
- Is funding above or below the 0.01% line, and on how many exchanges?
- Is open interest rising or falling while funding sits there?
- Which crowding state is shown, and did it just change?
- Is one exchange far from the others?
- What does holding through the next funding cost your size?
Alerts are available for Longs crowded, Shorts crowded and Crowding eased.
None of these is a buy or sell signal, alone or together. They describe positioning and holding cost so that a single funding number is not read in isolation. Funding Compass is an invite-only script; the access steps are in the script's Author's instructions.
This idea is for education only. It is not financial advice and makes no claim about future price or performance.