
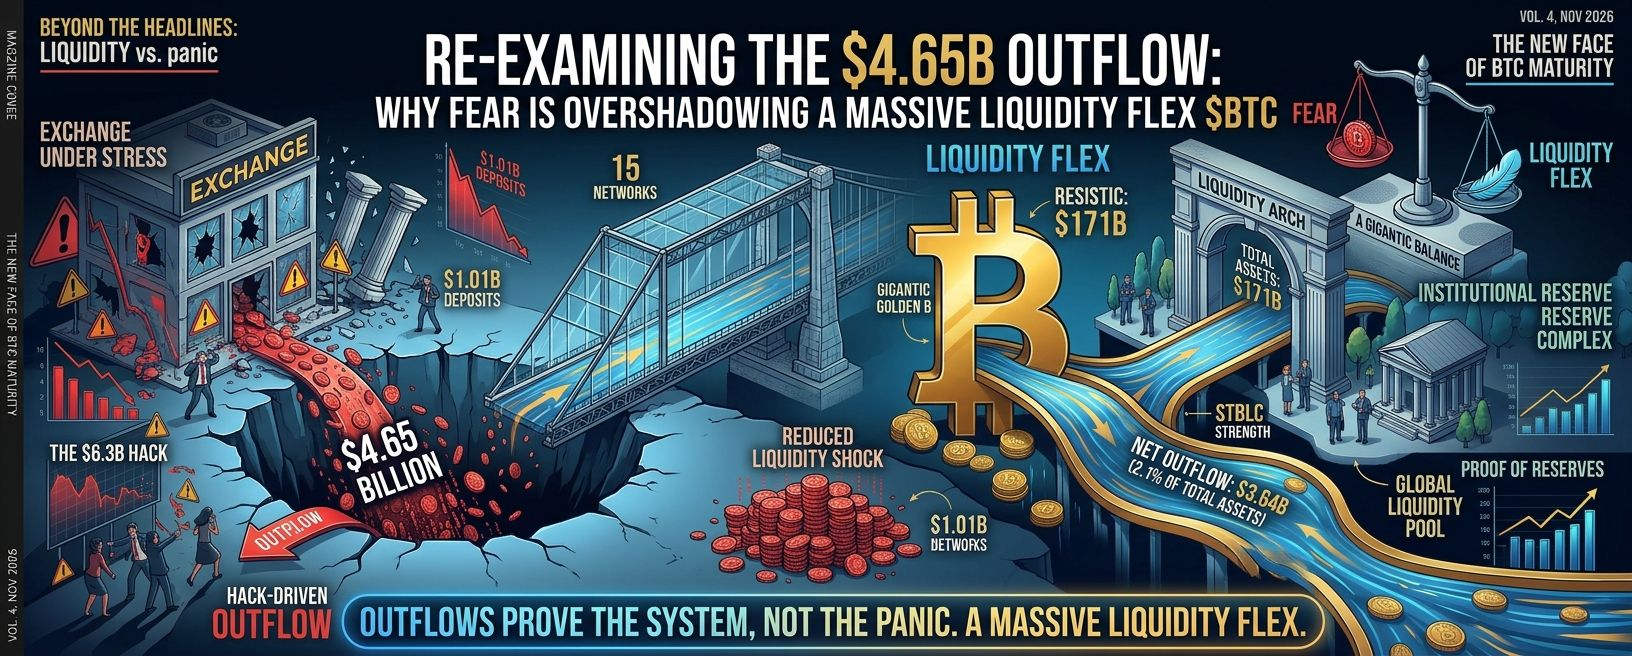

Re-Examining the $4.65B Outflow: Why Fear Is Overshadowing a Massive Liquidity Flex $BTC
The headline numbers look alarming at first glance: #BinanceProcesses$4.65BWithdrawals following a temporary system pause. Critics and panic-sellers point to the $3.64B net outflow as a sign of trouble. However, looking past the immediate knee-jerk reaction reveals a far more interesting and constructive narrative.
The Unique Angle: Stress Test as a Proof of Solvency
Instead of signaling an exchange crisis, this $4.65 billion withdrawal event functions as a real-time, real-world liquidity and solvency stress test for the market.
Fractional Risk Myth Debunked: A net outflow of $3.64 billion represents just ~2.1% of Binance’s $171B total assets under management. Processing nearly $5B seamlessly across 15 major networks within 9.5 hours proves deep operational liquidity— something traditional finance banks rarely match under similar run conditions.
The "Silent Accumulation" Offset: Amid the initial withdrawal rush, Binance still absorbed over $1.01B in new deposits. Institutional market makers and opportunistic buyers used the panic-driven dip around the $76K support area to accumulate $BTC on-chain.
Market Absorption vs. Capitulation: Bitcoin held its critical pivot zone ($74.4K – $76.1K) despite immense capital moving into self-custody. This confirms that coins leaving exchanges were largely moved to cold storage, reducing immediate sell-side liquidity rather than dumping onto open order books.
$BTC Technical Outlook & Candle Chart Representation
As withdrawal pressure stabilizes, $BTC is consolidating in a high-conviction demand zone:
$86.5K +--------------------------------------- (October High)
| | |
$81.4K +----|---|------------------------------ (Bearish Invalidation / Resistance)
| | | |
$78.0K +----|---|---|---[Current Consolidation]---- $BTC
| | | | | | | |
$76.1K +--+-+-+-+-+-+-+------------------------ (Key Swing Low Support)
| | | | |
$74.4K +--------------------------------------- (Lower Demand Boundary)
Key Technical Levels to Watch
Immediate Support Zone: $74,430 – $76,160 — Must hold daily closes to preserve the broader macro bull structure.
Crucial Resistance: $79,420 – $81,450 — A daily close above this level invalidates short-term bearish pressure and signals a trend reversal toward $83.7K+.
RSI & Momentum: Daily momentum indicators are hitting oversold extremes last seen in mid-summer, historically preceding strong relief bounces.
Summary & Takeaway
While headlines focus on capital flight, smart money sees market resilience. The successful processing of $4.65B in withdrawals removes structural uncertainty, clears out weak hands, and leaves the market healthier as $BTC builds a solid foundation for its next leg.