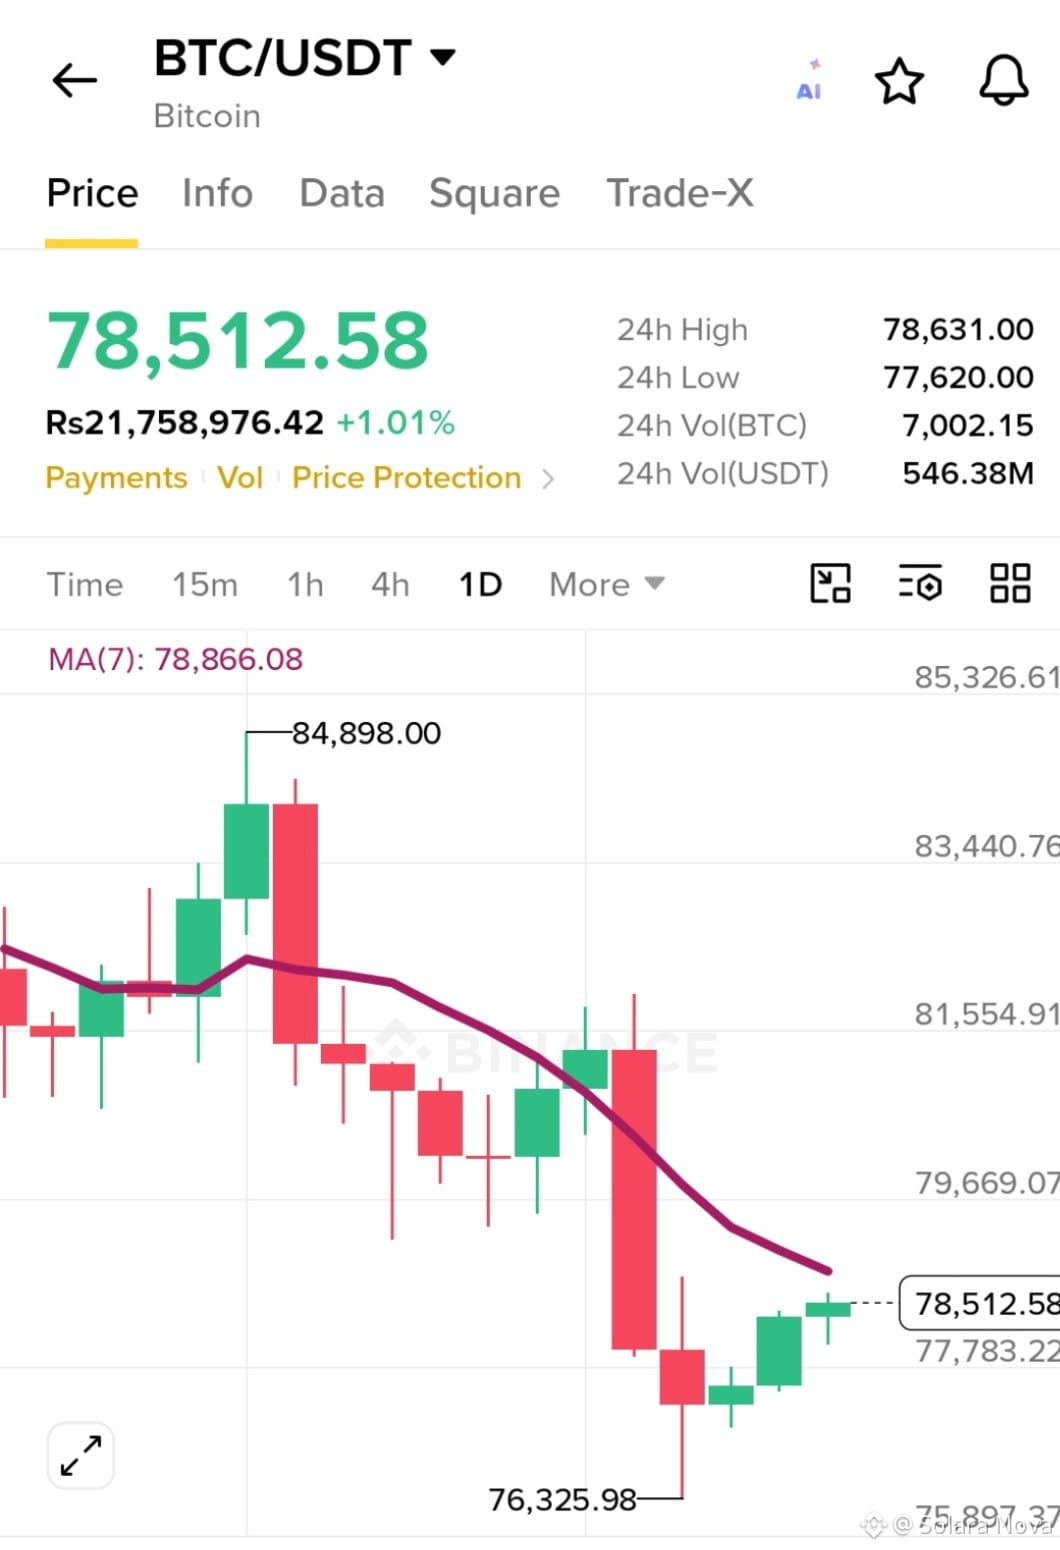
$BTC is showing a short-term recovery after a sharp price drop. According to the provided chart, BTC is trading at $78,512.58, up 1.01% in 24 hours.
📉 Resistance: $78,866–$79,800
🟢 Support: $77,600–$76,300
📈 Bullish Scenario: A strong breakout above $79,800 could open the way toward $80,500 and higher levels.
⚠️ Bearish Scenario: If BTC loses the $77,600 support zone, another test of $76,300 may follow.
The daily chart still shows bearish pressure, as the price remains below the 7-day moving average. Traders should watch volume and daily candle closes for confirmation before making decisions.
🔍 Market Outlook: Cautiously optimistic for a short-term bounce, but trend reversal is not confirmed yet.
#Bitcoin #BTC #CryptoAnalysis #BinanceSquare #CryptoMarket
📉 Resistance: $78,866–$79,800
🟢 Support: $77,600–$76,300
📈 Bullish Scenario: A strong breakout above $79,800 could open the way toward $80,500 and higher levels.
⚠️ Bearish Scenario: If BTC loses the $77,600 support zone, another test of $76,300 may follow.
The daily chart still shows bearish pressure, as the price remains below the 7-day moving average. Traders should watch volume and daily candle closes for confirmation before making decisions.
🔍 Market Outlook: Cautiously optimistic for a short-term bounce, but trend reversal is not confirmed yet.
#Bitcoin #BTC #CryptoAnalysis #BinanceSquare #CryptoMarket