


#BinanceProcesses$4.65BWithdrawals #Dogecoin #BTC
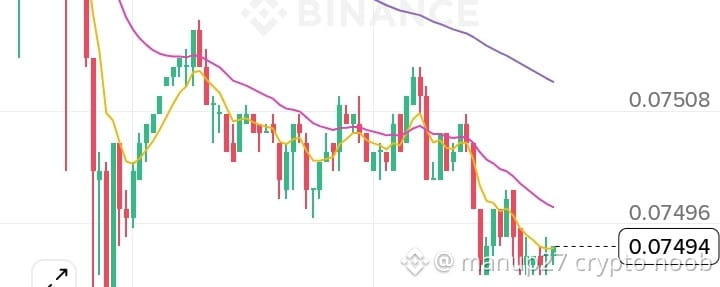
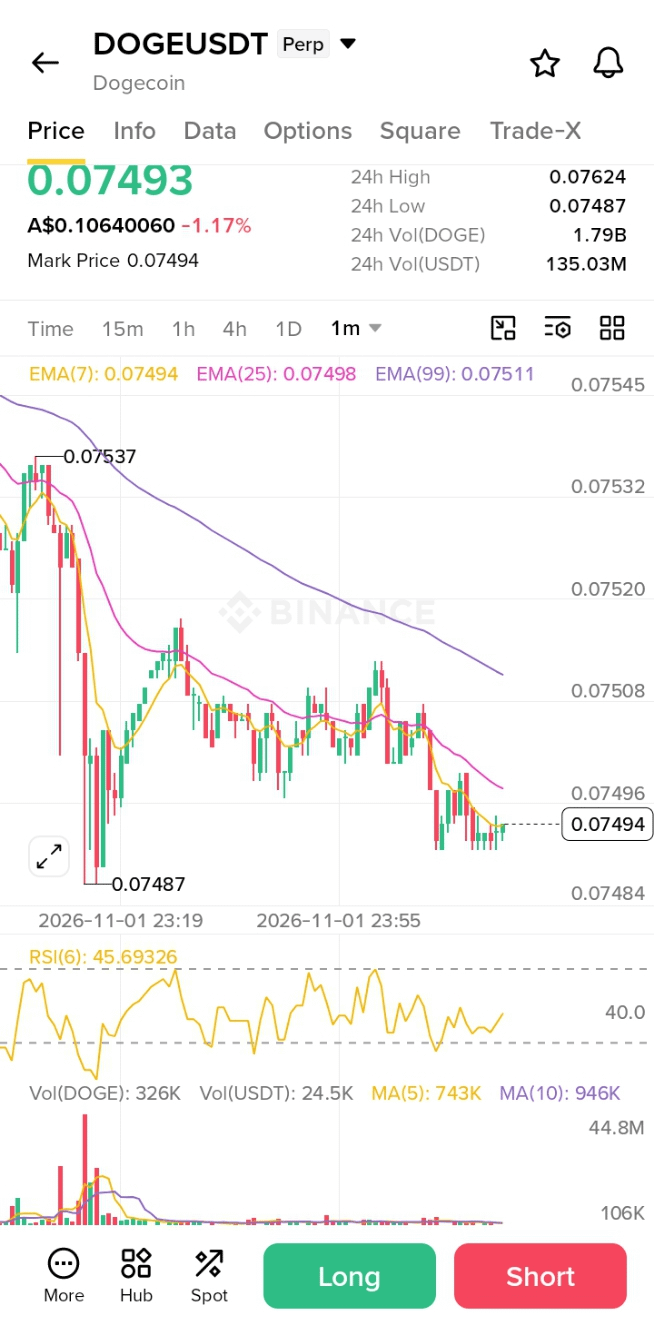
Based on DOGEUSDT 1-minute chart, the short-term trend looks slightly bearish, but a small upward bounce is possible.
Bearish bias
Wait for confirmation
1. What the indicators show
Price: 0.07493
EMA 7: 0.07494
EMA 25: 0.07498
EMA 99: 0.07511
RSI (6): 45.69
The price is below all three EMAs, suggesting sellers currently have more control. RSI below 50 also shows relatively weak momentum.
2. Important trading levels
Level
Price
Meaning
Resistance 1
0.07498
EMA 25
Resistance 2
0.07508
Stronger resistance
Resistance 3
0.07511
EMA 99
Support 1
0.07487
Important support
Support 2
0.07484
Next downside area
3. Possible scenarios
Scenario A: Price goes UP
Bullish confirmation
If price breaks and holds above 0.07498:
Target 1: 0.07508
Target 2: 0.07511
Target 3: 0.07517
Scenario B: Price goes DOWN
Bearish confirmation
If price breaks below 0.07487:
Target 1: 0.07484
Watch for further downside if selling volume increases.
4. My trading opinion
I would not enter Long immediately. The chart currently favors a bearish-to-sideways move.
My preferred approach: Wait for either:
A confirmed breakout above 0.07498 for a possible LONG.
A confirmed breakdown below 0.07487 for a possible SHORT.
These are scenarios, not guaranteed predictions. This is a 1-minute chart, so signals can change quickly.
Do research your self 👊👊👊👊👊