

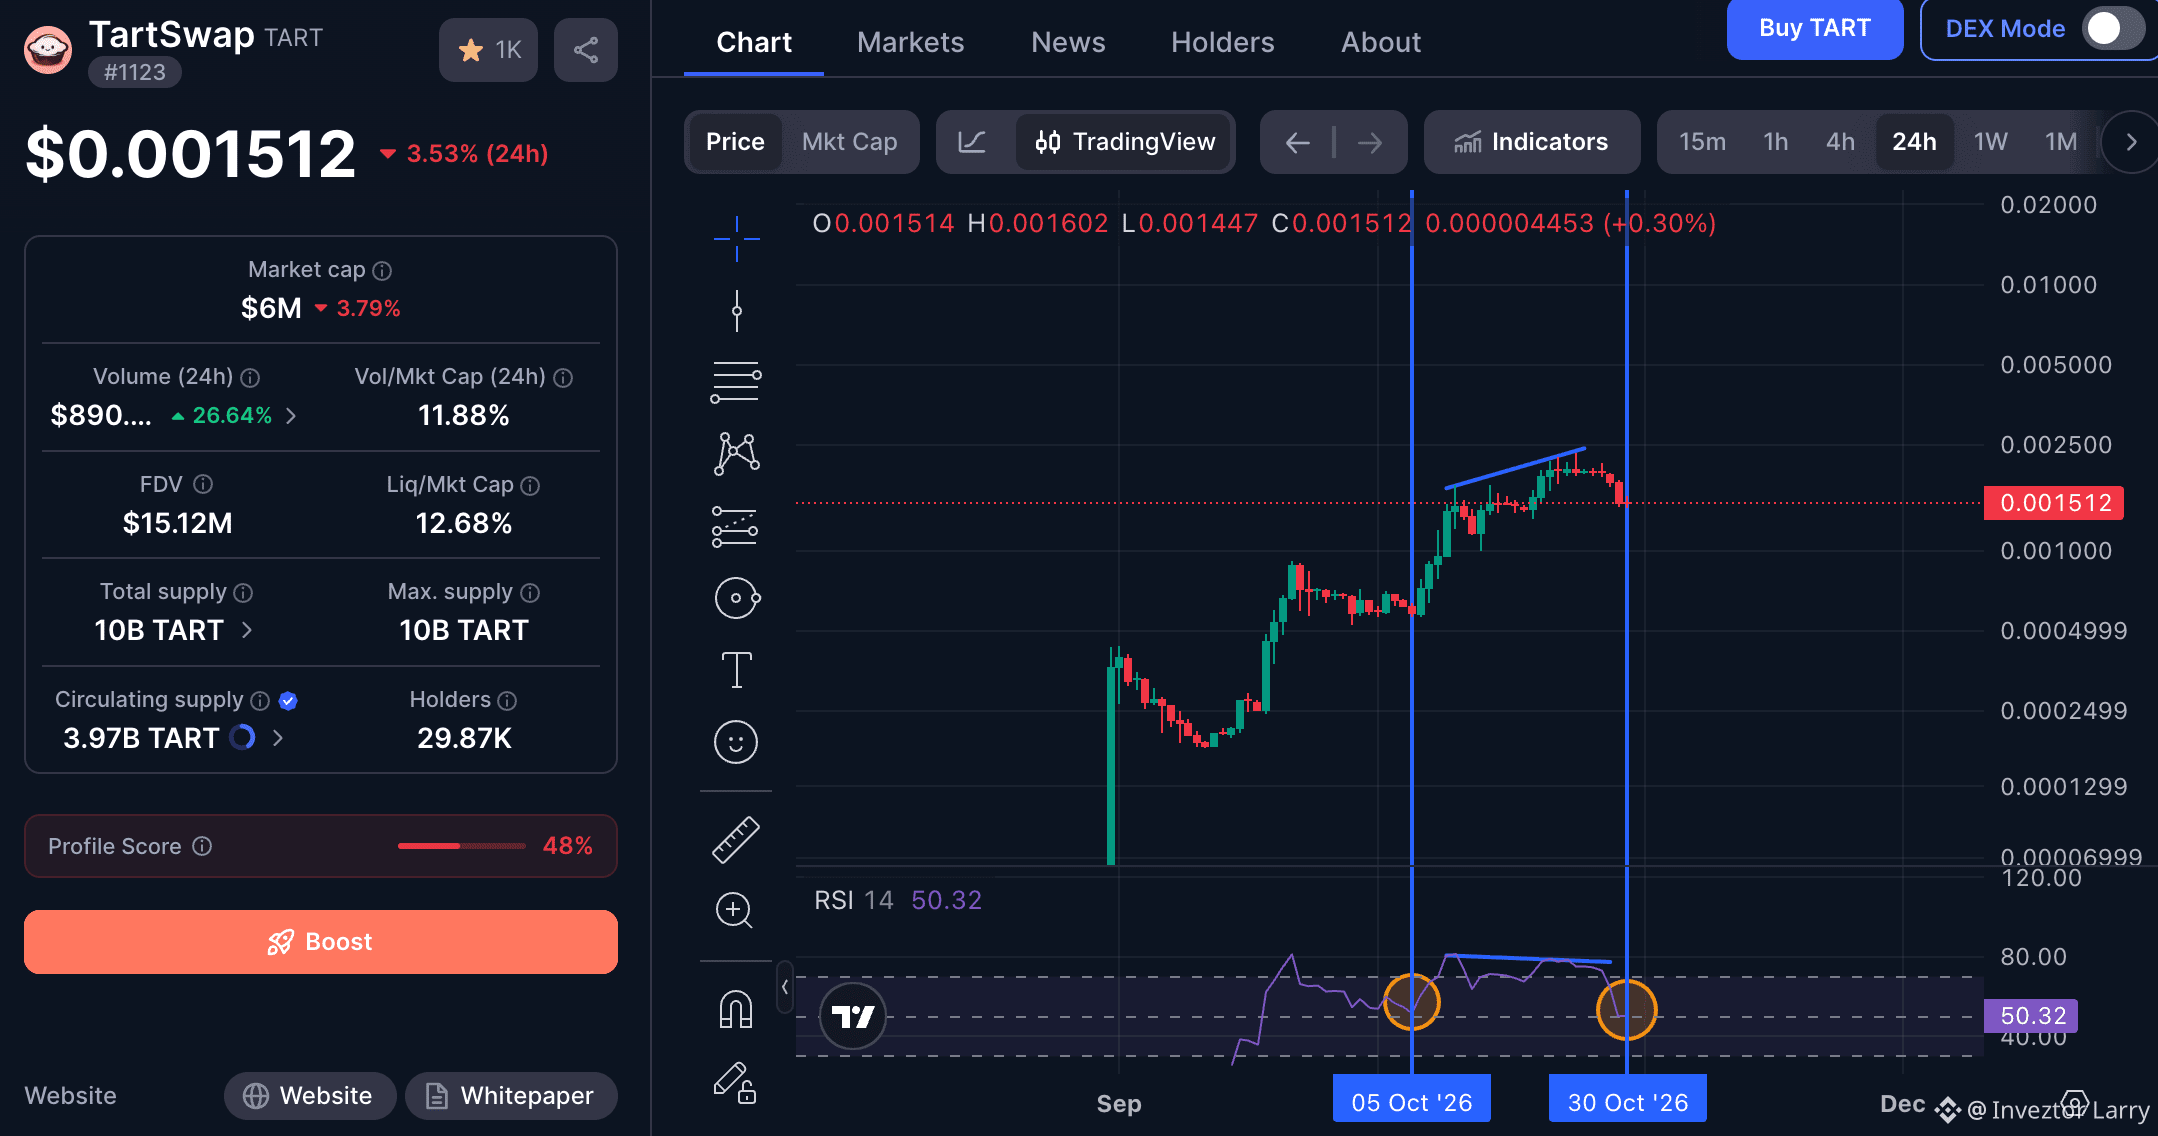
Let me break the $TART chart down Technically, for those who cant understand whats happening. Now despite whats happening in the market currently the $TART chart has been holding strong with a little pullback which it has done several times before the next leg up, now if you look at the two vertical lines drawn, you would see inbetween what we call RSI Divergence, which shows the difference in chart direction, now with that being said, you can from the first Verital line and circle drawn that the RSI got to the 50. mark before running up, now looking at the second vertical line and circle, you could see its currently sitting at same 50. mark, meanwhile the chart seems to be really holding strong on its retracement, as a trader this shows a lot about the strength of the project and how quick it could reover from here.

Rejoignez la communauté mondiale des adeptes de cryptomonnaies sur Binance Square
⚡️ Suviez les dernières informations importantes sur les cryptomonnaies.
💬 Jugé digne de confiance par la plus grande plateforme d’échange de cryptomonnaies au monde.
👍 Découvrez les connaissances que partagent les créateurs vérifiés.
Adresse e-mail/Nº de téléphone