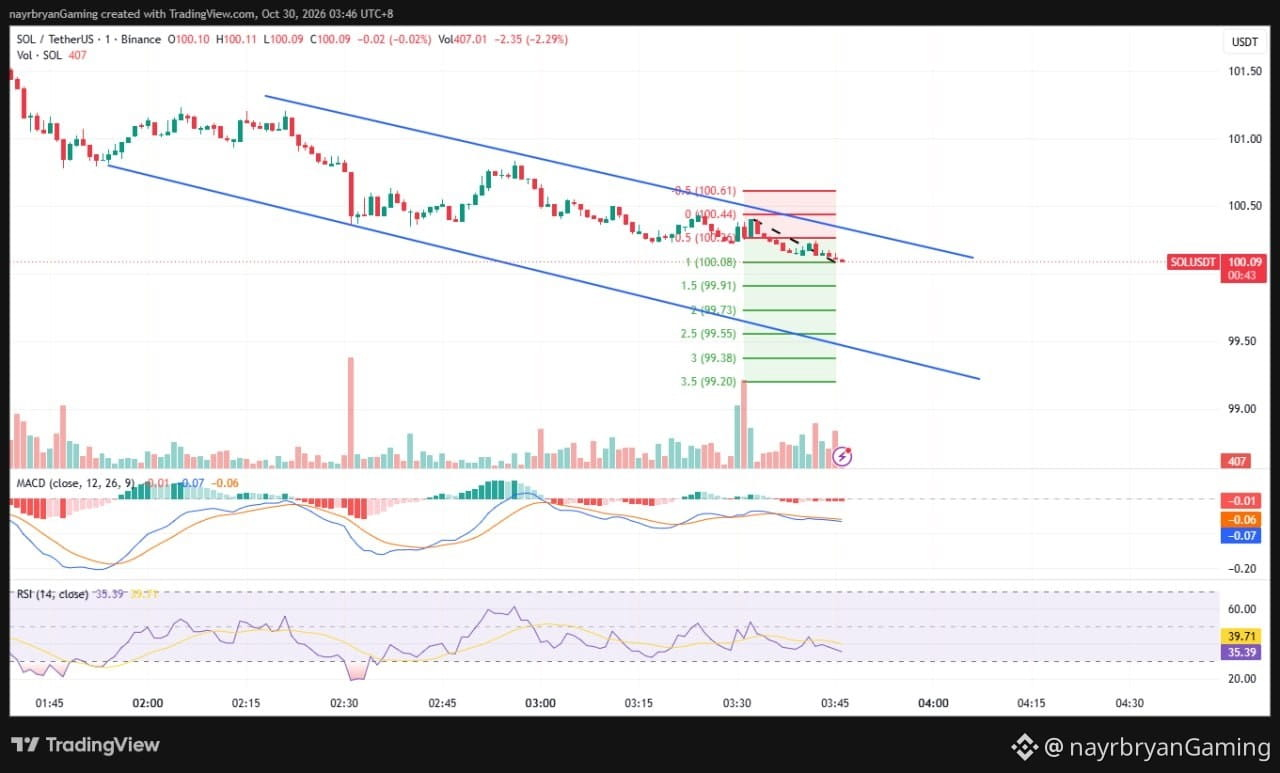
LIGHT ANALYSIS / CHART SETUP — SOL/USDT
📈 STRUCTURE OVERVIEW
Market Phase:
Descending channel → support breakdown → bearish continuation watch
Current Price:
100.09
Broken Structure / Resistance Zone:
100.30–100.43
Upper Resistance Reference:
100.61
Nearest Fibonacci Level:
100.08
Downside Fibonacci Levels:
99.91 → 99.73 → 99.55 → 99.38 → 99.20
📌 WHAT I'M WATCHING
SCENARIO A — BEARISH CONTINUATION
If SOL remains below 100.30–100.43 and breaks below 100.08 with continued selling pressure, price may rotate toward:
99.91 → 99.73 → 99.55 → 99.38 → 99.20
Confirmation: A sustained breakdown supported by price action and, ideally, stronger selling volume.
SCENARIO B — RESISTANCE RECLAIM
If SOL reclaims 100.30–100.43 and holds above the zone, the immediate bearish setup weakens.
Potential upside reference levels:
100.44 → 100.61
A move toward these levels would represent a recovery attempt, not automatic confirmation of a full trend reversal.
📊 INDICATOR CHECK
MACD: Slightly bearish configuration.
RSI: Approximately 35.39, indicating weak momentum and proximity to oversold territory.
Price Structure: Below the purple zone inside the descending channel.
Bearish Confirmation: Sustained move below 100.08.
Recovery Warning: Reclaim of 100.30–100.43.
📝 CHART NOTE
The descending channel supports the bearish structural reading, but it does not guarantee further downside. Because RSI is relatively low, monitor the possibility of a short-term rebound.
This is an educational chart framework, not a trade recommendation.
— @nayrbryanGaming
#SOLAnalysis #ChartSetup #PriceAction #SmartMoney #Fibonacci #CryptoTrading #Binance #DYOR #NFA