$HAEDAL 🔼 is finally making a strong move after spending months moving sideways‼️
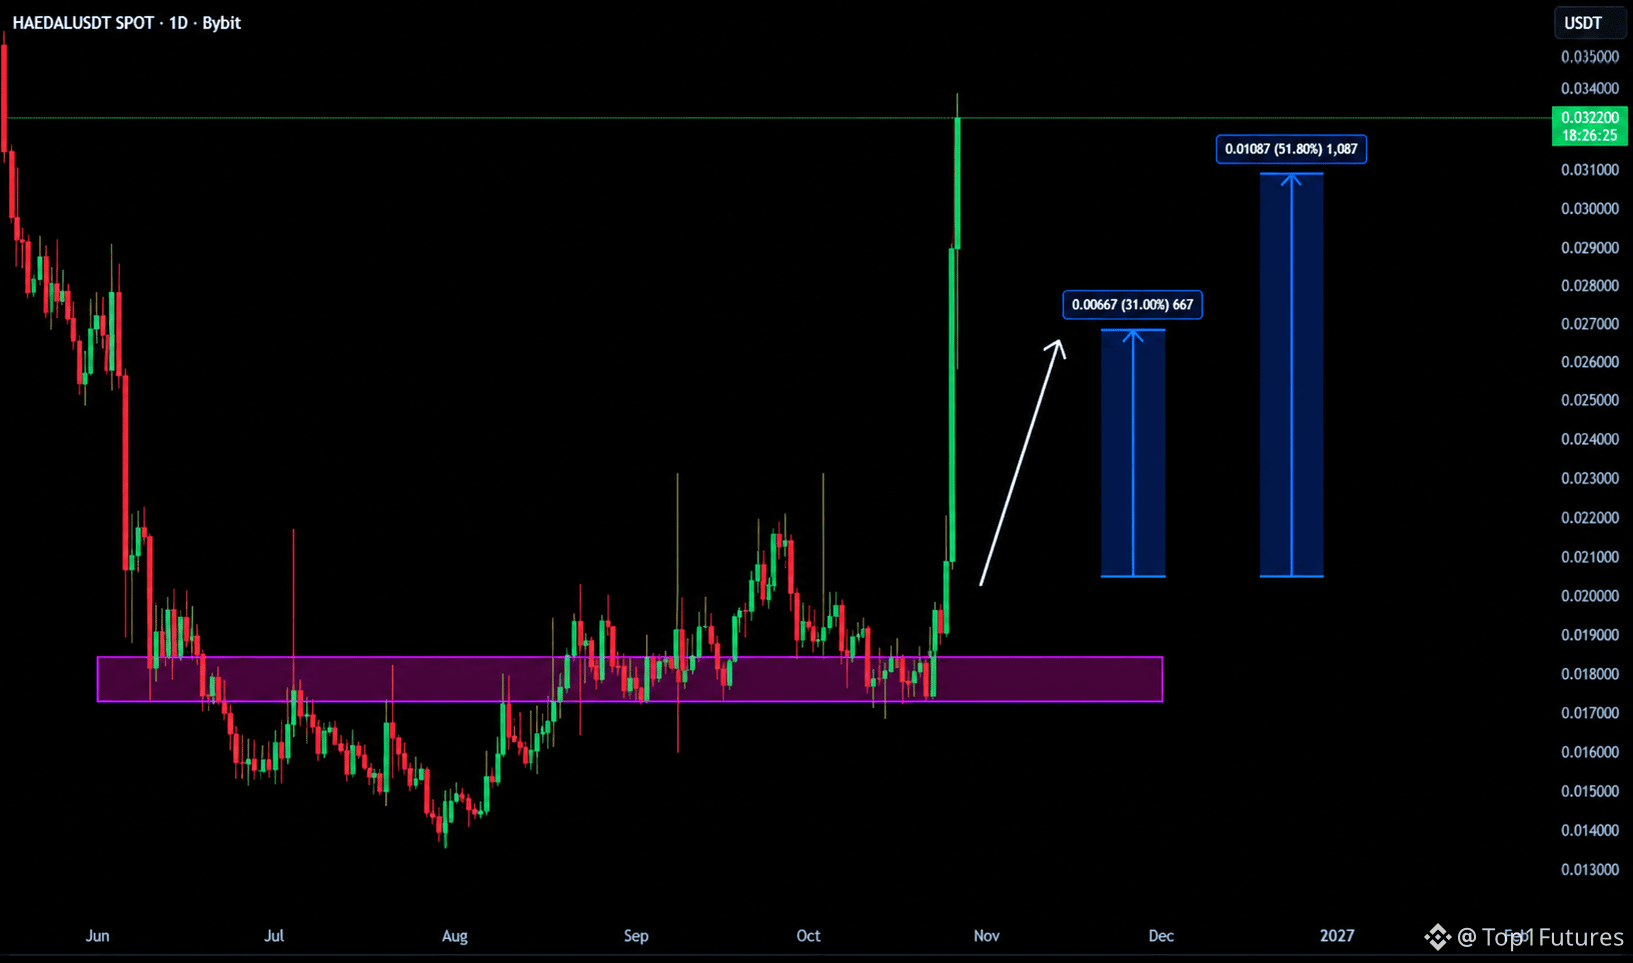
Looking at the daily chart, price has been holding around the $0.0175–$0.0187 support zone for quite some time. Sellers tried to push it lower before, but buyers kept defending this area. Now we are seeing a massive green candle breaking above the previous resistance, which is a good sign for the bulls. 🚀
If HAEDAL manages to stay above this breakout zone, I think we could see another leg up in the coming days or weeks. The chart is showing a possible move toward $0.0275, which is around 31% upside from the measured breakout level.
🔥 If buying pressure continues, the next bigger target could be near $0.0320, giving around 50% potential upside.
But don't rush in blindly! A pullback to retest the breakout area is also possible. If price holds there, the bullish move may continue.
📈 Bias: Bullish
🎯 Targets: $0.0275 → $0.0320
Let's see if buyers can keep this momentum alive! 👀