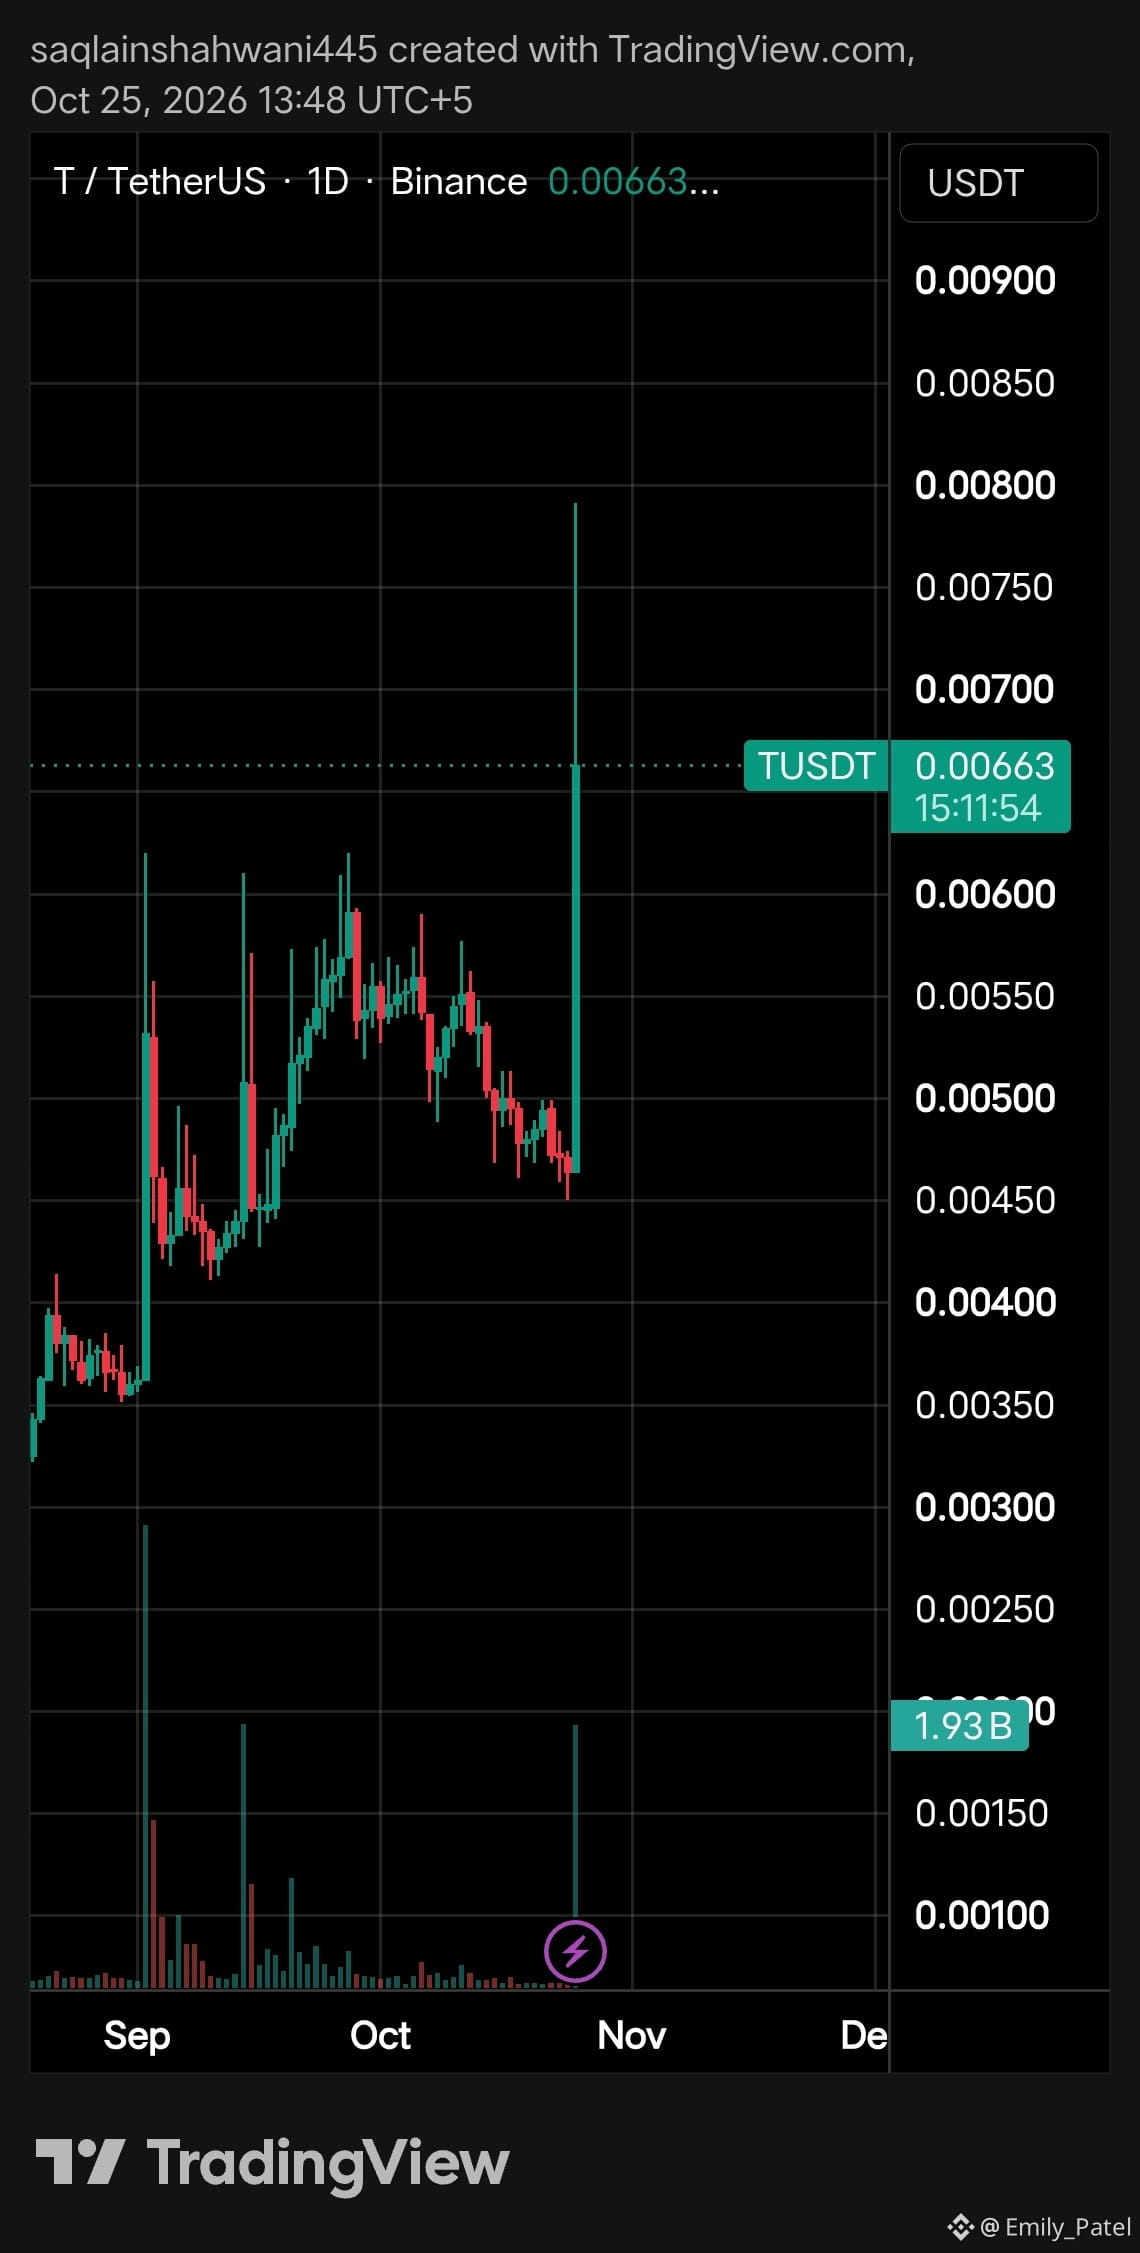
$T just woke up and the daily chart is LOUD 👀
After weeks of chopping between 0.0045 and 0.0062, T/USDT printed one massive green daily candle: roughly +40%, from ~0.0046 to 0.00663. It even spiked to ~0.0079 along the way. Volume exploded to 1.93B, one of the biggest volume days since early September.
📊 Levels I'm watching:
• 0.0062: the old range highs. A daily close above it confirms the breakout, and a retest of it is where bulls want to see support.
• 0.0079: the wick high. Sellers showed up here.
• 0.0045: the base where this move started. Lose it and the breakou
t idea is dead.
⚠️ That long upper wick means some traders already took profits. Don't chase a +40% candle. Let the daily close and the retest tell the story.
Are you buying the retest or staying out? Dro
p it below 👇
Not financial advice. DYOR.
#T #TUSDT #Breakout #CryptoTrading #BinanceSquare