


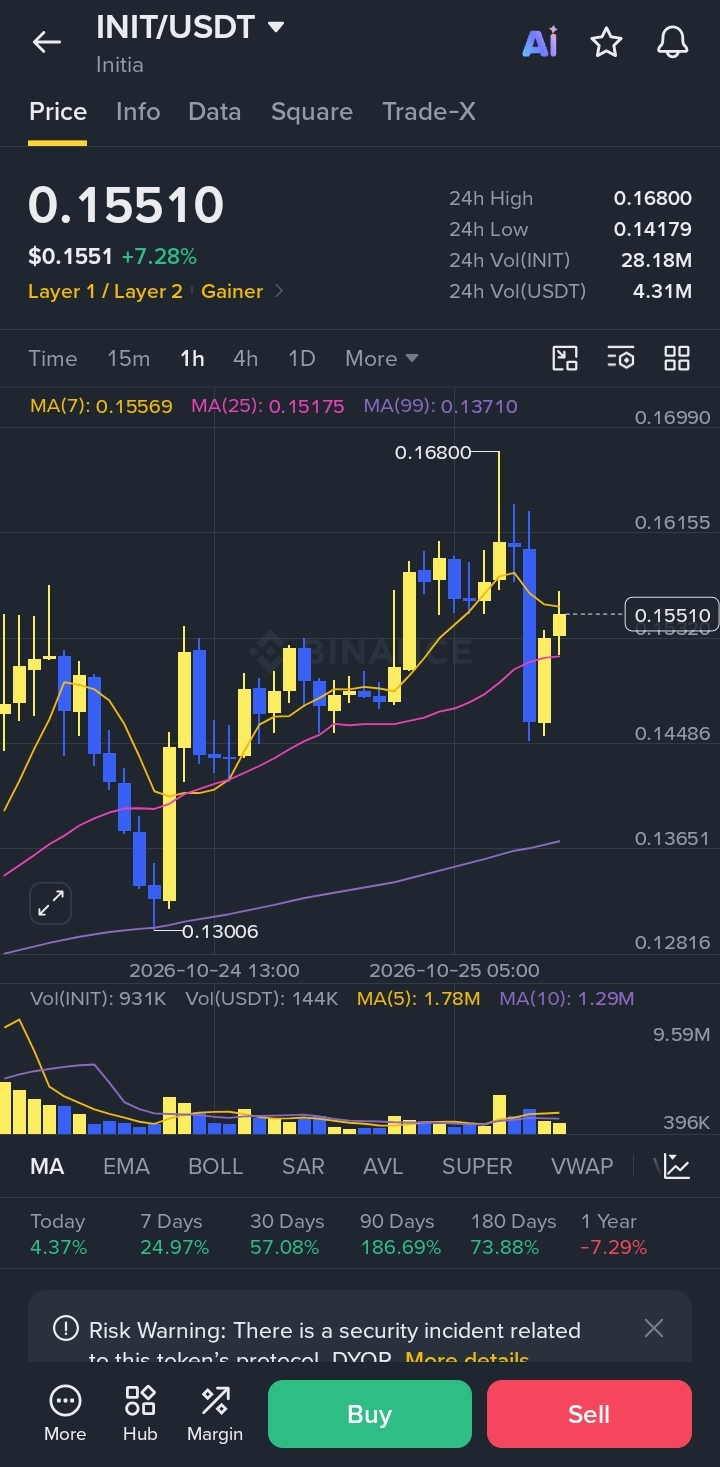
Kline / Chart Analysis (1H)
Price has printed a powerful impulsive leg higher. From the mid-0.12s it ripped through previous resistance and is now sitting at $0.1552 (+6.56% on the day), with the 24h high at $0.1680.
Key observations from the chart:
Structure: Clear higher highs + higher lows after the breakout. The big green candle + volume spike around the 11:00–12:00 area confirms real buying, not just a thin wick.
- EMAs: EMA20 ($0.1529) is firmly above EMA50 ($0.1469). Price is trading above both → short-term trend is bullish.
- Supports visible on the chart:
- $0.1293 (major pivot low / S1)
- $0.1266 (S2)
- $0.1242
- Momentum:
- RSI(14) ≈ 57 → neutral, not overbought. Still room to run.
- MACD histogram is slightly negative (-6.09e-4) → short-term momentum cooling after the sharp move, but the overall MACD lines are still elevated.
- Volume is near average (0.9×), so the move isn’t exhausted yet, but we’re also not seeing fresh aggressive buying at these levels.
Bottom line on the klines: Bullish bias remains intact as long as price holds above the EMA20 cluster (~$0.1529). A deeper pullback toward the $0.129–0.130 zone would be a classic retest of the breakout origin.
🔷️Trade Plan
The chart is showing a potential long setup on a pullback to the $0.1293 support (the level built from two pivot lows). Current price is already ~20% higher, so this is a *wait-for-retest* plan, not a chase.
Long Trade Plan (Potential Setup – 1H)
| Parameter | Level | Notes |
|-----------------|--------------------|--------------------------------------------|
| **Entry Zone** | $0.1293 – $0.1301 | Reference mid: $0.1297 |
| **Stop Loss** | $0.1288 | Risk ≈ $0.0009 |
| **Invalidation**| Close below $0.1293| Idea is dead if this level breaks |
| **Take Profit 1**| $0.1311 | 1.5R |
| **Take Profit 2**| $0.1320 | 2.5R |
| **Take Profit 3**| $0.1329 | 3.5R (measured move) |
| **Risk : Reward**| 1 : 2.5 | Clean |
Entry Conditions the app is watching(currently 2/3 core signals):
- ✅ Price above EMA20
- ✅ EMA20 > EMA50 (uptrend alignment)
- ❌ MACD histogram above zero
- ✅ RSI between 50–72
- ❌ Volume ≥ 20-bar average
How I’m treating this right now:
1. Do not chase the current $0.1552 price for this setup.
2. Wait for a meaningful pullback into the $0.129–0.130 zone.
3. Only enter if the entry conditions re-align (especially MACD histogram turning positive + volume confirmation).
4. If price instead holds above EMA20 and continues higher, the original support-based long becomes lower probability and you’d need a fresh plan (breakout continuation or higher-timeframe levels).