

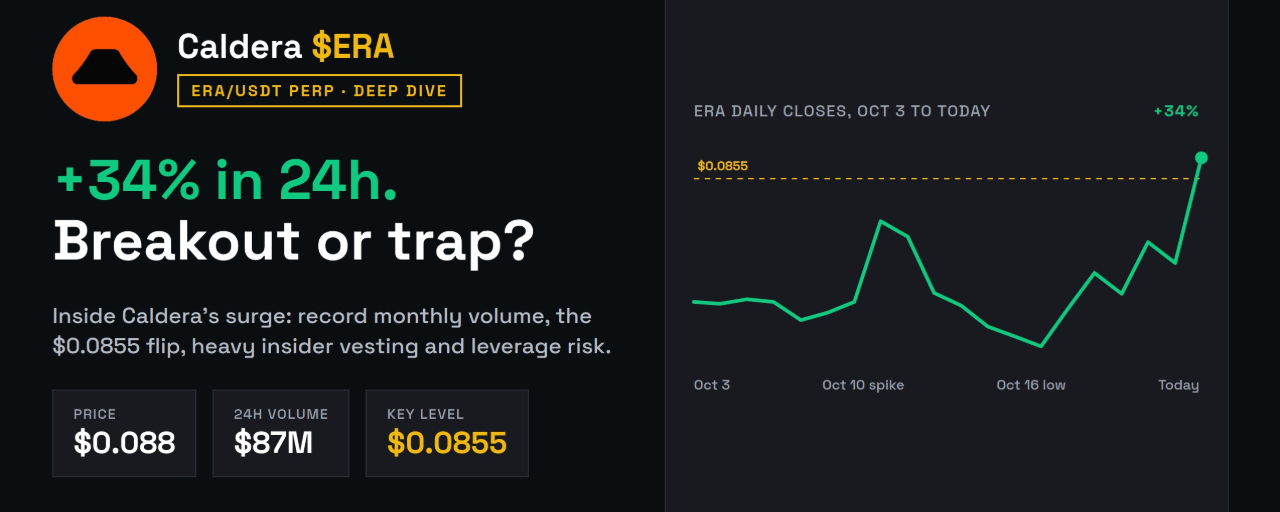

ERA is up about 34% in 24 hours, trading near $0.088, while most of the market is red. Here's a data-driven look at what's behind the move, what the structure says, and where the risks are.
1. The backdrop: ERA is moving against the tape
ERA's jump comes in a weak market. Bitcoin is around $80,600 and just lost its 50-day moving average for the first time in 66 days. Total crypto market cap is about $2.72T, down roughly 3% on the day. Bitcoin dominance sits near 60%, a sign that altcoins are taking the heavier damage. The Fed decision on October 28 is the next macro event.
So ERA isn't riding a market-wide bid. That points to idiosyncratic, speculative flow: traders rotating into a low-cap name while the rest of the market bleeds. This kind of relative strength can be a genuine accumulation signal, but it can also be a sign of thin, leveraged flow, which is why the next sections matter.
2. Reading the chart: where this spike sits in October
ERA's October price action tells a clear story. Based on daily closes:
Oct 3-9: Quiet. Price held in a tight $0.062-$0.065 band on very low volume, often only $1-3M a day. Oct 10: First pop, +20% to about $0.0785, followed by a $68M volume day on Oct 11 with a lower close. Oct 10-16: The full gain unwound. Price fell about 26% to roughly $0.058 in six days. Oct 17-20: A second leg, up about 30% in four days to around $0.075. Oct 21-22: Small pullback, with volume fading back to around $19M. Today: A new push to about $0.088, with 24h volume near $87M.
Three observations stand out:
Higher highs. Today's price is above the October 10 closing high (about 13% higher) and above the roughly $0.0855 intraday peak from the earlier spike. Structurally, this is the first genuine breakout of the month, not another retest of the same ceiling.
Volume is at a monthly record. $87M against a $13M market cap is roughly 6.6x. The Oct 11 spike was about 5x, and early-October baseline volume was a fraction of that.
But high volume has failed before. On Oct 11, huge volume came with a lower close, a classic sign of distribution into strength. What matters is whether today's volume produces a strong daily close or another rejection. Watch the close, not the wick.
3. Key levels
Measured from the October 16 low (about $0.058) to today's price (about $0.0886):
$0.09 / $0.10: Psychological resistance. Above $0.10, there's little recent structure in the data I reviewed. $0.0855-$0.088: The breakout zone. Closing back below it would suggest a failed breakout. $0.0768 (38.2% retracement): Lines up with the Oct 10 closing high of $0.0785. A natural first support on a pullback. $0.0732 (50%): Near the Oct 20 close of about $0.075. $0.0696 (61.8%): Roughly where the prior range's upper half sits. $0.058-$0.054: The October low and the September 16 low of $0.0542. Losing this would erase the entire recovery.
4. The supply question: "tiny float" is only half the story
Most data aggregators show about 175M ERA circulating (17.5% of the 1B supply), giving a market cap near $13M and a fully diluted valuation of roughly $89M. That's the basis for calling ERA a thin micro-cap.
But trackers disagree. One vesting tracker shows closer to 320M ERA unlocked, around 32% of supply. On that basis, market cap at today's price would be nearer $28M, not $13M. Neither figure is "wrong". They count different wallets and schedules. It matters because your read of how thin the float is, and how much dilution to expect, depends on which number you trust.
The bigger concern is the vesting schedule. The core team (147.5M) and early backers (320.8M) together hold about 47% of supply. Their one-year cliff ended in July 2026, and the allocations now vest linearly over about 24 months. Add monthly releases from the foundation, community treasury and R&D, and my estimate is roughly 23-27M new ERA per month entering the market. Depending on which float figure you use, that's about 8-14% added supply every month.
That's not an immediate crash risk, but it's constant background sell pressure. Rallies need continuous new demand just to stay flat.
5. Fundamentals: real project, unclear current demand
Caldera is a genuine infrastructure player. It has helped launch 100+ rollups since 2023, raised $25M with Founders Fund leading the Series A, and built the Metalayer to link rollups with shared liquidity. ERA is used for gas, validator staking and governance. More recent developments include ERA Drops (February 2026) and a reported partnership with BitcoinOS.
Valuation context: ERA's all-time high was about $2, implying a fully diluted valuation near $2B. At about $0.088, the FDV is roughly $89M, down around 95%. That's a steep reset, but it doesn't tell you the token is cheap. Value depends on whether rollup-as-a-service demand converts into actual ERA demand through fees and staking. I couldn't find fresh on-chain metrics, so I can't say whether usage is growing, and I found no specific news that explains today's move.
6. Why the perp matters: leverage and funding
Buy-side flow is leading on Binance Futures and LBank, so the perpetual is setting the price. That raises four things to watch on ERAUSDT:
Funding rate: Strongly positive funding means crowded longs and rising flush risk. Neutral funding on a rising price suggests the rally isn't overleveraged. At a 0.10% funding rate, a $10,000 long pays about $10 each settlement. Check the contract page for the current interval, since many Binance perps settle every 4 hours. Open interest: Price up with OI up means new money. Price up with OI down means shorts are being squeezed out, which tends to be short-lived. Liquidation distance: ERA's recent daily moves of +20%, +10%, +9% and +13% mean 10x leverage has almost no room. A 5x position, with roughly 20% to liquidation, would have been wiped by the 26% unwind after Oct 10. Funding cap: ERAUSDT has previously carried a wider ±2% funding cap, which signals Binance treats it as volatile. Confirm current settings before trading.
7. Scenarios
Bull case: ERA closes the day above $0.0855-$0.088, volume stays elevated into the weekend, and funding stays reasonable. Targets are $0.09, then $0.10. This is the cleanest setup, but it has to survive a weak broader market and the Fed decision.
Base case: Momentum cools and price retraces to $0.073-$0.077 before deciding. That would still be a healthy pullback in a higher range.
Bear case: The breakout fails, funding flips and longs get flushed. Price falls back through $0.07 toward the $0.058 base. The October 10 to 16 unwind is the template.
I'm not assigning probabilities. The honest read is that the setup improved today, but the evidence from earlier October spikes plus a risk-off market argues for caution.
8. Practical risk management
Size so a full stop-out is survivable, especially on the perp. Avoid chasing a vertical candle. Waiting for a daily close and a retest gives you a better entry. Don't open leveraged positions right before a funding settlement if you're paying. Take partial profits into strength. Watch the Oct 28 Fed decision and Bitcoin's reaction to its 50-day average, since a broader move can overwhelm any single token's setup.
Bottom line
ERA's breakout is real on the chart: higher highs, record monthly volume, and relative strength in a weak market. But it's a flow-driven micro-cap move with no confirmed catalyst, heavy ongoing insider vesting, and a history this month of spikes that fully retraced. The decisive question is whether it can close above its previous highs and hold them once the excitement cools.
Not financial advice. Perpetual contracts use leverage and can result in total loss of margin. Always do your own research.
#ERA #Caldera #ERAUSDT #BinanceSquare #Altcoins