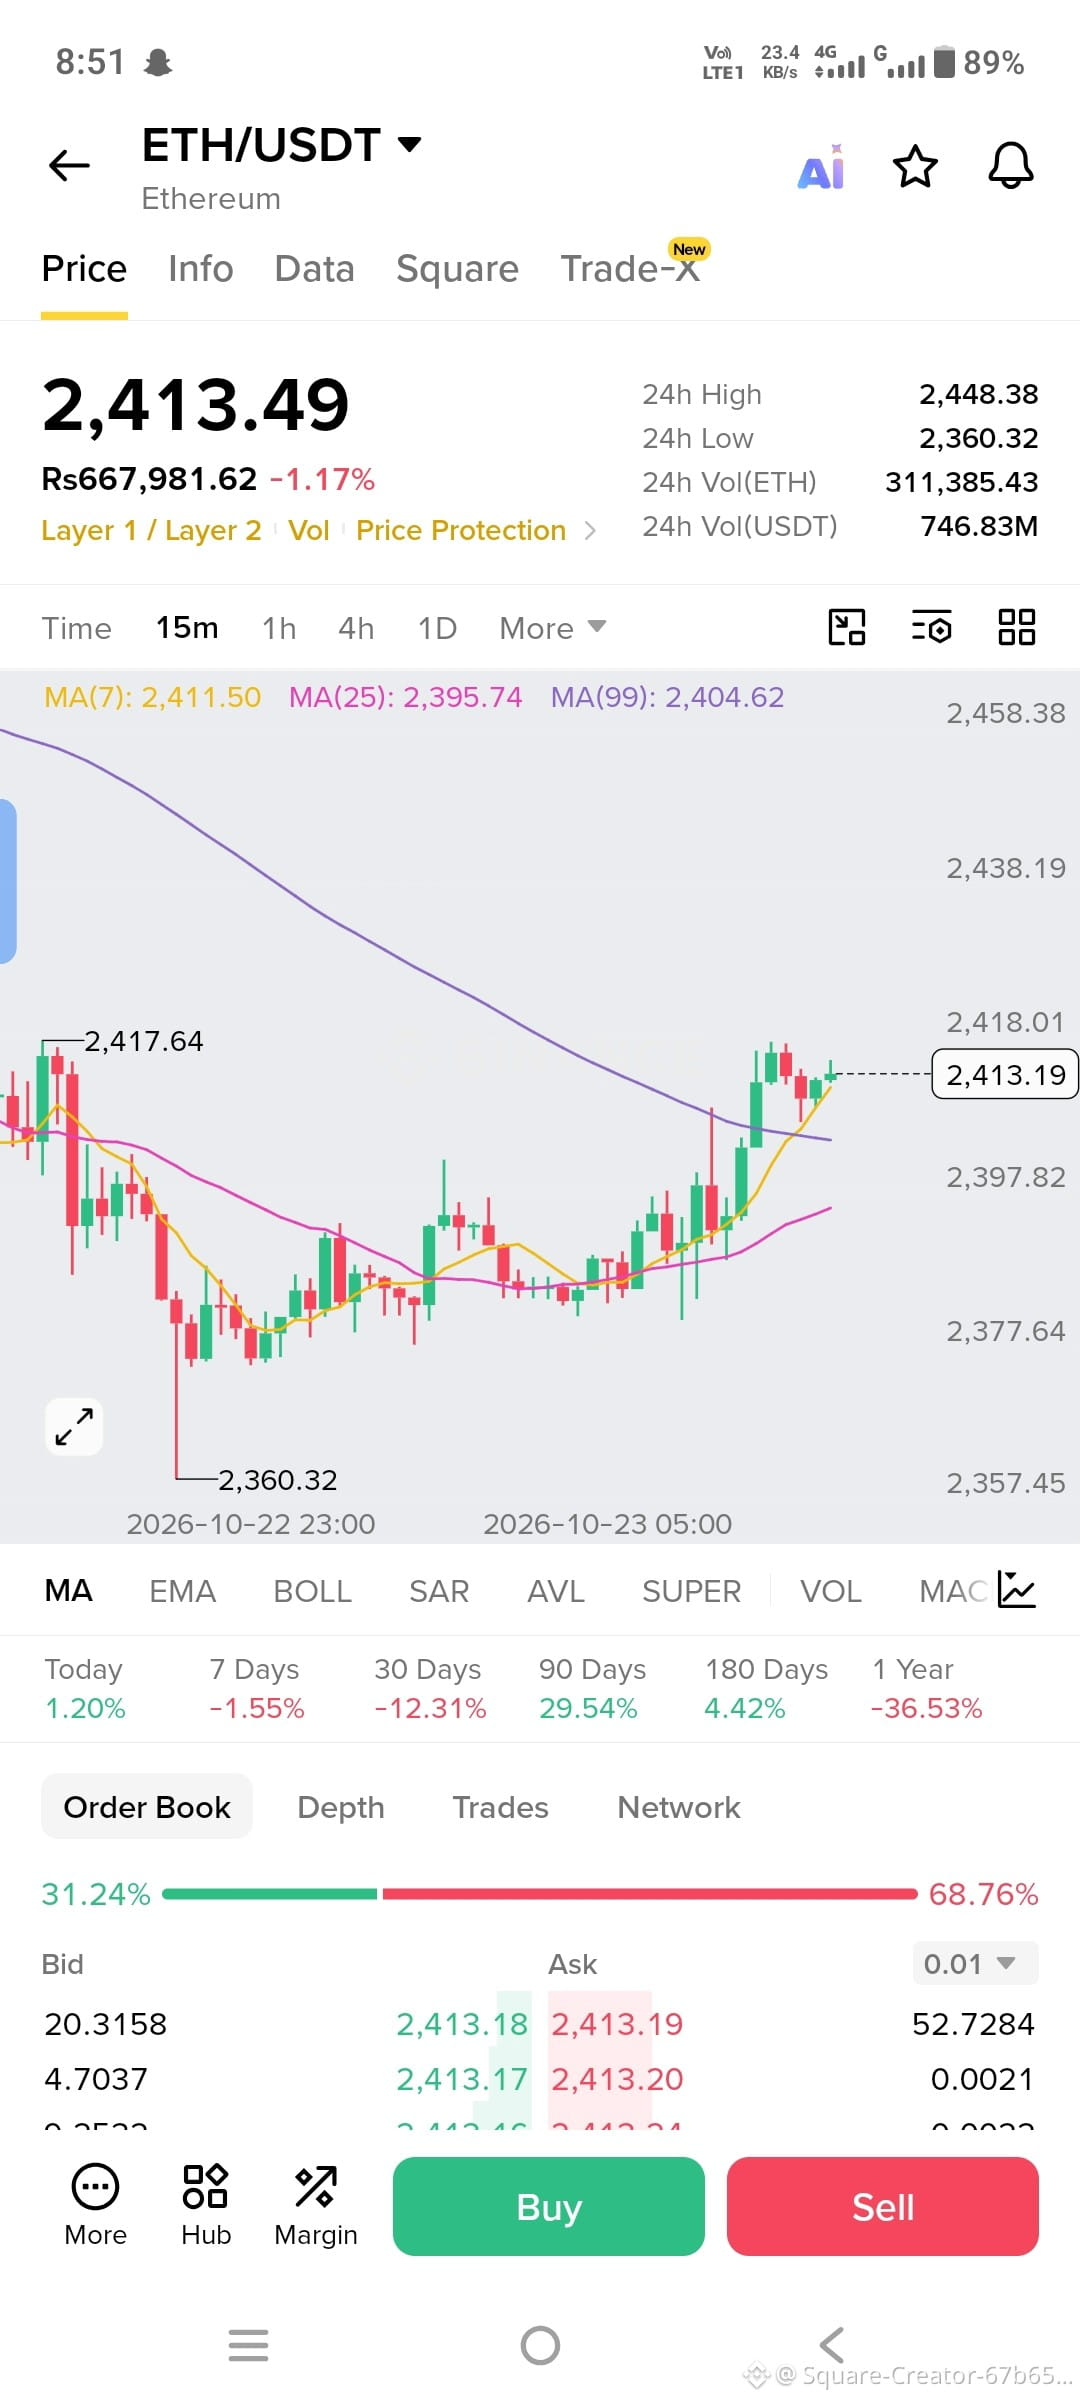
📊 ETH/USDT Market Analysis
Timeframe: 15 Minutes
Current Price: $2,413.49
🟢 Resistance Levels
$2,417.64 — Immediate resistance
$2,418–$2,425 — Potential breakout zone
$2,438 — Next upside target
$2,448 — 24-hour high and major resistance
🔴 Support Levels
$2,408–$2,404 — Immediate support zone
$2,397 — Key support
$2,377 — Stronger support
$2,360 — 24-hour low
📈 Will ETH Go Up or Down?
🟢 Bullish Scenario: If ETH breaks above $2,418 and holds, it could move toward $2,425 and then $2,438.
🔴 Bearish Scenario: If ETH falls below $2,404, it could retest $2,397. Further weakness may bring $2,377 into focus.
🎯 My Trading Outlook
ETH is showing short-term bullish momentum on this 15-minute chart. The price is trading above the moving averages shown, but resistance near $2,418 needs to be broken convincingly.
Short-term bias: Cautiously bullish, pending breakout confirmation.
⚠️ These levels are based on your screenshot, not live-market verification. Avoid entering a futures trade without a stop-loss.
Key level to watch: $2,418. Above it, bullish momentum may continue; rejection could trigger a pullback.