


If you only learn one technical analysis concept, make it this one. Support and resistance show up on every chart, in every market and on every timeframe. They’re the foundation that most other tools are built on.
Here’s what they are, how to find them, and how to use them without falling into common traps.
What Are Support and Resistance?
Support is a price zone where buyers have repeatedly stepped in, stopping the price from falling further. Think of it as a floor.
Resistance is a price zone where sellers have repeatedly appeared, stopping the price from rising further. Think of it as a ceiling.
These levels form because traders remember them. If price bounced from a level before, many people will watch it, place orders there, and react when price returns.
Think in Zones, Not Lines
Beginners draw a single razor-thin line and then get frustrated when price pokes slightly through it. Real support and resistance are zones, usually a band of prices rather than one exact number.
Draw your level as a rectangle that covers the wicks and bodies around the area where price reacted. This makes your analysis more realistic and your stops less likely to be hit by tiny moves.
How to Find Strong Levels
Not every level is equally important. The stronger ones tend to have:
Multiple touches: the more times price reacted there, the more traders are watching it
Higher timeframes: a level on the daily or weekly chart matters more than one on the 5-minute chart
Clear reactions: sharp reversals, not just a slight pause
Round numbers: psychological levels like whole thousands often attract orders
Volume: heavy trading activity at a level suggests real interest
Start by zooming out and marking the obvious highs and lows. If you have to squint to see a level, it probably isn’t significant.
The Role Flip
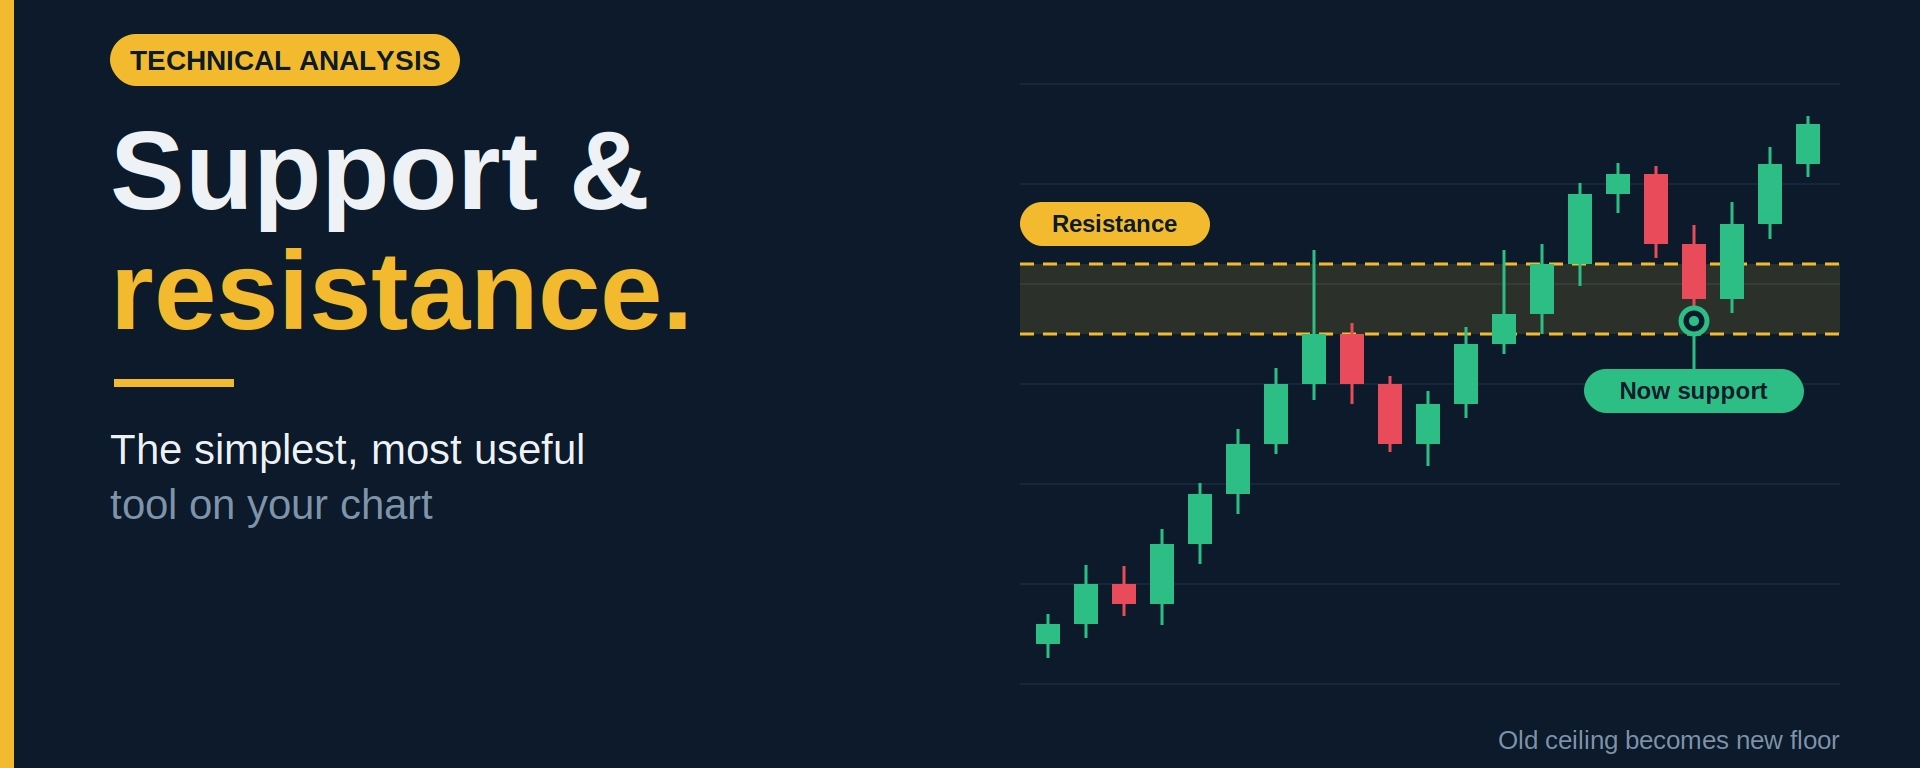
When price breaks through resistance and holds above it, that old ceiling often becomes new support. The reverse is also true: broken support can become resistance.
This works because traders who missed the move, or got trapped on the wrong side, tend to act when price returns to the same area. A retest of a broken level is one of the most watched setups in trading.
Three Ways to Use Levels
1. Planning entries. Wait for price to reach a level you’ve marked, then look for a reaction before entering, instead of buying in the middle of nowhere.
2. Placing stops. Put your stop-loss just beyond the level that would invalidate your idea, with enough room for normal noise. If support breaks, the reason for your trade is gone.
3. Setting targets. Use the next level in the direction of your trade as a logical place to take profit, or at least trim your position.
Common Mistakes to Avoid
Drawing too many levels until the chart is unreadable
Treating levels as exact lines instead of zones
Assuming a level will always hold. Every level eventually breaks
Buying support or selling resistance blindly, without waiting for a reaction
Ignoring the higher timeframe trend
How Levels Fail
Remember that support and resistance describe where traders have acted before, not where they must act again. Each time a level is tested, it can get weaker, because the orders waiting there get used up.
That’s why risk management comes first. Always know where your idea is wrong, and size your position so that being wrong is affordable.
The Bottom Line
Support and resistance won’t predict the future, but they give structure to a chart that otherwise looks like chaos. Mark a few strong zones on higher timeframes, wait for price to come to you, and always plan your exit before you enter.
Master this one skill and many other tools will make more sense.
How many levels do you keep on your chart? Tell me in the comments. 👇
Disclaimer: This article is for educational purposes only and is not financial advice. Crypto assets are highly volatile and you can lose your capital. Always do your own research and only invest what you can afford to lose.
#Crypto #TechnicalAnalysis #SupportAndResistance #TradingBasics #BinanceSquare