


Polkadot (DOT) Price Analysis: Can DOT Hold the $1.090 Support Zone?
Polkadot (DOT) Market Update | Technical Analysis | October 18, 2026
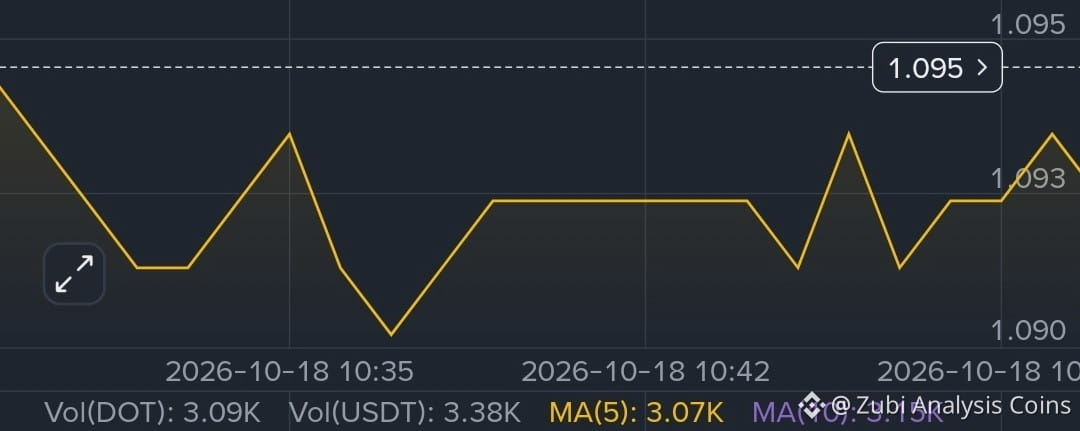
The cryptocurrency market continues to present challenges for traders, and Polkadot (DOT) is showing signs of short-term weakness. According to the Binance chart screenshot reviewed for this analysis, DOT/USDT was trading around 1.095 USDT, down approximately 7.05% over the previous 24 hours.
The current price action raises an important question: can DOT maintain its nearby support level, or will sellers push the price lower?
Let's examine the market structure, key technical levels, moving average, and order-book data to better understand the situation.
1. DOT Market Overview
The screenshot shows the following market information:
- Trading pair: DOT/USDT
- Displayed price: 1.095 USDT
- 24-hour change: -7.05%
- 24-hour high: 1.181 USDT
- 24-hour low: 1.090 USDT
- Displayed MA60: Approximately 1.098 USDT
The daily decline indicates significant selling pressure over the previous 24 hours. However, a single price snapshot cannot explain the entire market trend. Traders should also consider broader market conditions, Bitcoin's direction, and subsequent price movements.
These figures reflect the supplied screenshot rather than independently verified live market data.
2. Market Structure: Sellers Remain in Focus
The displayed short-term chart suggests that DOT is struggling to establish upward momentum. Its price is trading below the MA60, which is sloping downward.
When an asset trades below a declining moving average, it can indicate that sellers have maintained short-term control. Nevertheless, moving averages are lagging indicators, and they do not predict future prices with certainty.
For buyers to demonstrate a potential recovery, DOT would need to regain important price areas and sustain upward momentum. A temporary move higher alone would not necessarily confirm a trend reversal.
For now, the chart supports a cautious approach rather than assuming that a recovery has already begun.
3. Support Zone: Why 1.090 USDT Matters
The 1.090 USDT area is an important level to monitor because it corresponds to the recent low visible in the screenshot.
Support is a price area where buying interest may emerge and slow a decline. However, support levels are not guaranteed floors, and prices can break below them.
If DOT revisits 1.090 USDT, traders may observe whether buyers defend the area and whether price action stabilizes. A decisive move below this level could indicate additional weakness.
On the other hand, a rebound supported by improving price action may suggest that buyers are attempting to regain control.
Confirmation is important in either scenario.
4. Resistance: Can DOT Reclaim 1.098–1.100 USDT?
The first resistance area to watch is approximately 1.098 USDT, near the displayed MA60. The 1.100 USDT level is another nearby psychological price area.
If DOT moves above these levels and holds them, short-term momentum could improve. Traders may then assess whether buying activity supports the move.
However, if the price repeatedly fails to break through resistance, selling pressure may remain dominant.
These are observation levels derived from the supplied chart, not guaranteed price targets. Market conditions can change rapidly.
5. What Does the Order Book Tell Us?
The screenshot displays approximately 61.22% bids and 38.78% asks in the order-book indicator.
At that moment, displayed bid-side activity was greater than ask-side activity. This may suggest stronger visible buying interest in the displayed order book.
However, order-book ratios can change quickly. Limit orders may be added, cancelled, or executed, and displayed bids do not guarantee that buyers will prevent a decline.
For a more complete assessment, traders should compare order-book information with actual executed trades, trading volume, and price behavior.
6. Risk Management Comes First
Cryptocurrency markets are volatile, and even well-planned technical analysis can be wrong. Traders should avoid entering positions based on a single indicator or an unconfirmed support level.
Before making a decision, consider the broader trend, potential downside, position size, and the amount of risk involved. Avoid excessive leverage and never risk money you cannot afford to lose.
Patience and disciplined research are more useful than reacting emotionally to every price movement.
Final Conclusion: What Comes Next for DOT?
Based on the supplied screenshot, Polkadot is experiencing short-term bearish pressure, with the price near 1.095 USDT and below the declining MA60.
The key areas to monitor are:
- 1.090 USDT: Nearby support
- 1.098 USDT: First resistance near the MA60
- 1.100 USDT: Additional resistance to watch
Holding support and reclaiming resistance could improve the short-term picture, while a breakdown below support could indicate further weakness. Neither outcome is confirmed by the screenshot alone.
What is your view on Polkadot? Will DOT defend 1.090 USDT and attempt a recovery, or could sellers push it lower? Share your analysis and reasoning in the comments.
Follow CryptoInsightPro for more cryptocurrency market insights and educational analysis.
Disclaimer: This article is for educational and informational purposes only and does not constitute financial advice. The analysis is based on a user-provided screenshot and is not a live market forecast. Always conduct your own research before making financial decisions.
#Polkadot #DOT #CryptoAnalysis #TechnicalAnalysis #BinanceSquare