

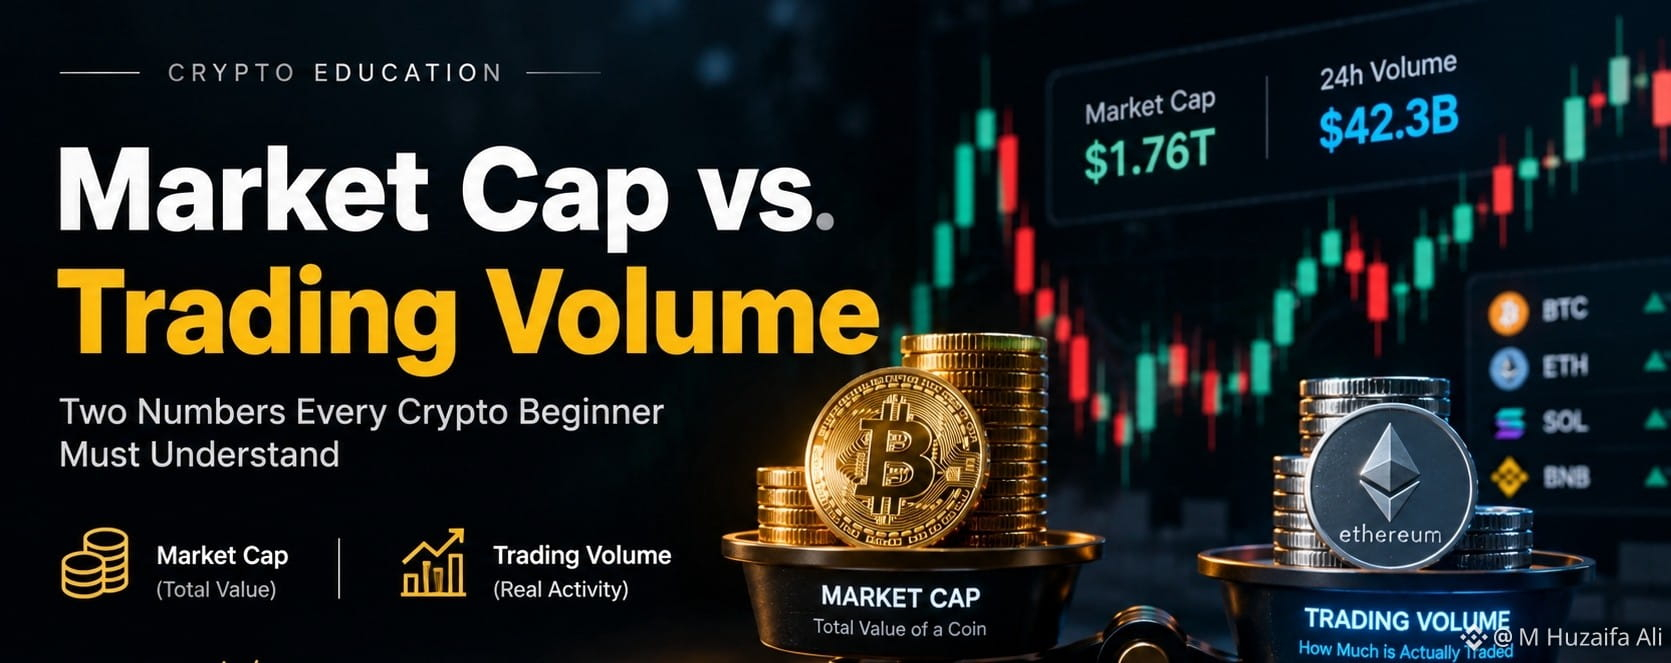

Same market. Different stories.
When you explore the crypto market, two numbers appear almost everywhere: market capitalization and trading volume.
Many beginners see a cryptocurrency with a huge market cap and assume it must be strong. Others see a sudden increase in trading volume and believe its price is about to rise.
But both assumptions can be misleading.
These two metrics measure different things. Understanding the difference can help you interpret market data more intelligently instead of reacting to numbers without context.
Let's break them down.
1. What Is Market Capitalization?
Market capitalization, commonly called market cap, estimates the total value of a cryptocurrency's circulating supply at its current market price.
Formula:
Market Cap = Current Price × Circulating Supply
Imagine a cryptocurrency has:
- Current price: $10
- Circulating supply: 5 million coins
Its market cap would be:
$10 × 5,000,000 = $50 million
This does not mean $50 million has been invested in the cryptocurrency. It means the circulating coins, valued at the current price, have a combined market value of $50 million.
What does market cap tell us?
Market cap helps you understand the relative size of a cryptocurrency compared with other projects.
A larger market cap generally means a project has a higher total market valuation. However, market cap alone does not prove that a project is reliable, useful, profitable, or fairly valued.
A coin's market cap can also change because its price or circulating supply changes.
Remember: Market cap measures estimated value, not the amount of money flowing through the market.
2. What Is Trading Volume?
Trading volume measures how much of an asset has been traded during a specific period, often the previous 24 hours.
Depending on the platform, volume may be reported in coins or in monetary value, such as US dollars.
Imagine that a cryptocurrency records $8 million in trading volume over 24 hours.
That means trades worth approximately $8 million were recorded during that period according to the platform's methodology.
It does not mean $8 million of new money entered the project. The same coins can change hands multiple times, and reported volume can differ between exchanges and data providers.
What does trading volume tell us?
Volume helps you assess how active the market is.
- Higher volume can indicate increased participation or attention.
- Lower volume can indicate quieter trading or reduced participation.
- A sudden volume spike may accompany important news, a price breakout, a sell-off, or speculative activity.
But volume does not tell you the direction of the next price move by itself. Buyers and sellers participate in every completed trade.
Remember: Trading volume measures trading activity, not guaranteed demand or future price direction.
3. Market Cap vs. Trading Volume: The Key Difference
Think of a shopping centre.
Its estimated total property value is different from the value of purchases made inside it today.
Market cap is like the estimated value of the shopping centre. Trading volume is like the total value of transactions taking place inside it during a given period.
One describes size. The other describes activity.
Here's the comparison:
Market Cap| Trading Volume
Estimates total circulating value| Measures trading over a period
Helps compare relative market size| Helps assess market activity
Changes with price and circulating supply| Changes as trading activity changes
Does not directly measure liquidity| Can provide clues about liquidity
Is not proof of project quality| Is not proof of bullish momentum
One important distinction: volume and liquidity are related, but they are not identical. Liquidity is about how easily an asset can be bought or sold without significantly affecting its price. Trading volume alone cannot fully measure it.
4. Why Looking at Only One Number Can Mislead You
Consider two hypothetical cryptocurrencies.
Coin A ( $MSFTB )
- Market cap: $2 billion
- 24-hour trading volume: $10 million
Coin B ( $AAPLB )


- Market cap: $100 million
- 24-hour trading volume: $20 million
Coin A has a much larger market valuation. Coin B has recorded more trading activity during the same period.
Does that automatically make Coin B the stronger project? No.
Coin B might be attracting genuine interest, reacting to news, or experiencing short-term speculation. Coin A might simply be trading quietly.
Likewise, Coin A's larger market cap does not automatically make it safer.
These numbers raise questions; they do not provide complete answers.
To understand either asset, you would also need to examine factors such as liquidity, circulating and total supply, token distribution, project utility, and the broader market environment.
5. How to Read Both Metrics Together
A more useful approach is to interpret market cap and trading volume together.
Scenario 1: Large market cap + low trading volume
The asset has a substantial valuation but relatively little trading activity during the observed period. Check whether this is normal for the asset and whether its order books are sufficiently liquid.
Scenario 2: Small market cap + high trading volume
The asset is attracting substantial activity relative to its size. This may reflect growing interest, a news event, speculation, or unusual trading. Investigate the cause rather than assuming the activity is sustainable.
Scenario 3: Rising price + rising volume
This can support the view that participation is increasing during a price advance. However, it does not guarantee that the move will continue.
Scenario 4: Falling price + rising volume
This can indicate increased activity during a sell-off. It may reflect stronger selling pressure, changing expectations, or disagreement among market participants.
In every scenario, context matters. Compare volume with the asset's own historical levels, examine the timeframe, and check whether the data comes from reliable sources.
6. The Beginner's Checklist
Before drawing a conclusion about a cryptocurrency, ask yourself:
- What is its market cap, and how is its circulating supply calculated?
- Is its trading volume unusually high or low compared with its normal activity?
- Is the volume spread across credible markets or concentrated on a single venue?
- Is the price rising or falling during that activity?
- Are token supply, liquidity, or recent news influencing the numbers?
These questions will not eliminate uncertainty, but they can help you avoid simplistic conclusions.
Final Thoughts
Market cap and trading volume are two useful pieces of the crypto puzzle, but neither tells the whole story.
Market cap helps you understand an asset's estimated size. Trading volume helps you understand how actively it is being traded.
One describes valuation; the other describes activity. When interpreted alongside price action, liquidity, supply data, and fundamentals, they provide a more meaningful picture of the market.
The goal is not to predict every move. It is to understand what the numbers actually tell you—and what they don't.
Let's discuss: If you could teach a crypto beginner only one concept first, would it be market cap, trading volume, or liquidity? And why?
Disclaimer: This article is for educational purposes only and is not financial advice. Cryptocurrency markets are volatile, and these metrics should not be used in isolation to make financial decisions.
— The Rational Crypto Mind | Learn. Analyze. Grow.
#BitcoinSurpasses$82K CryptoEducation, #Bitcoin, #TradingTales ingVolume, and #MarketCa