

NEARUSDT Weekly Time Frame:
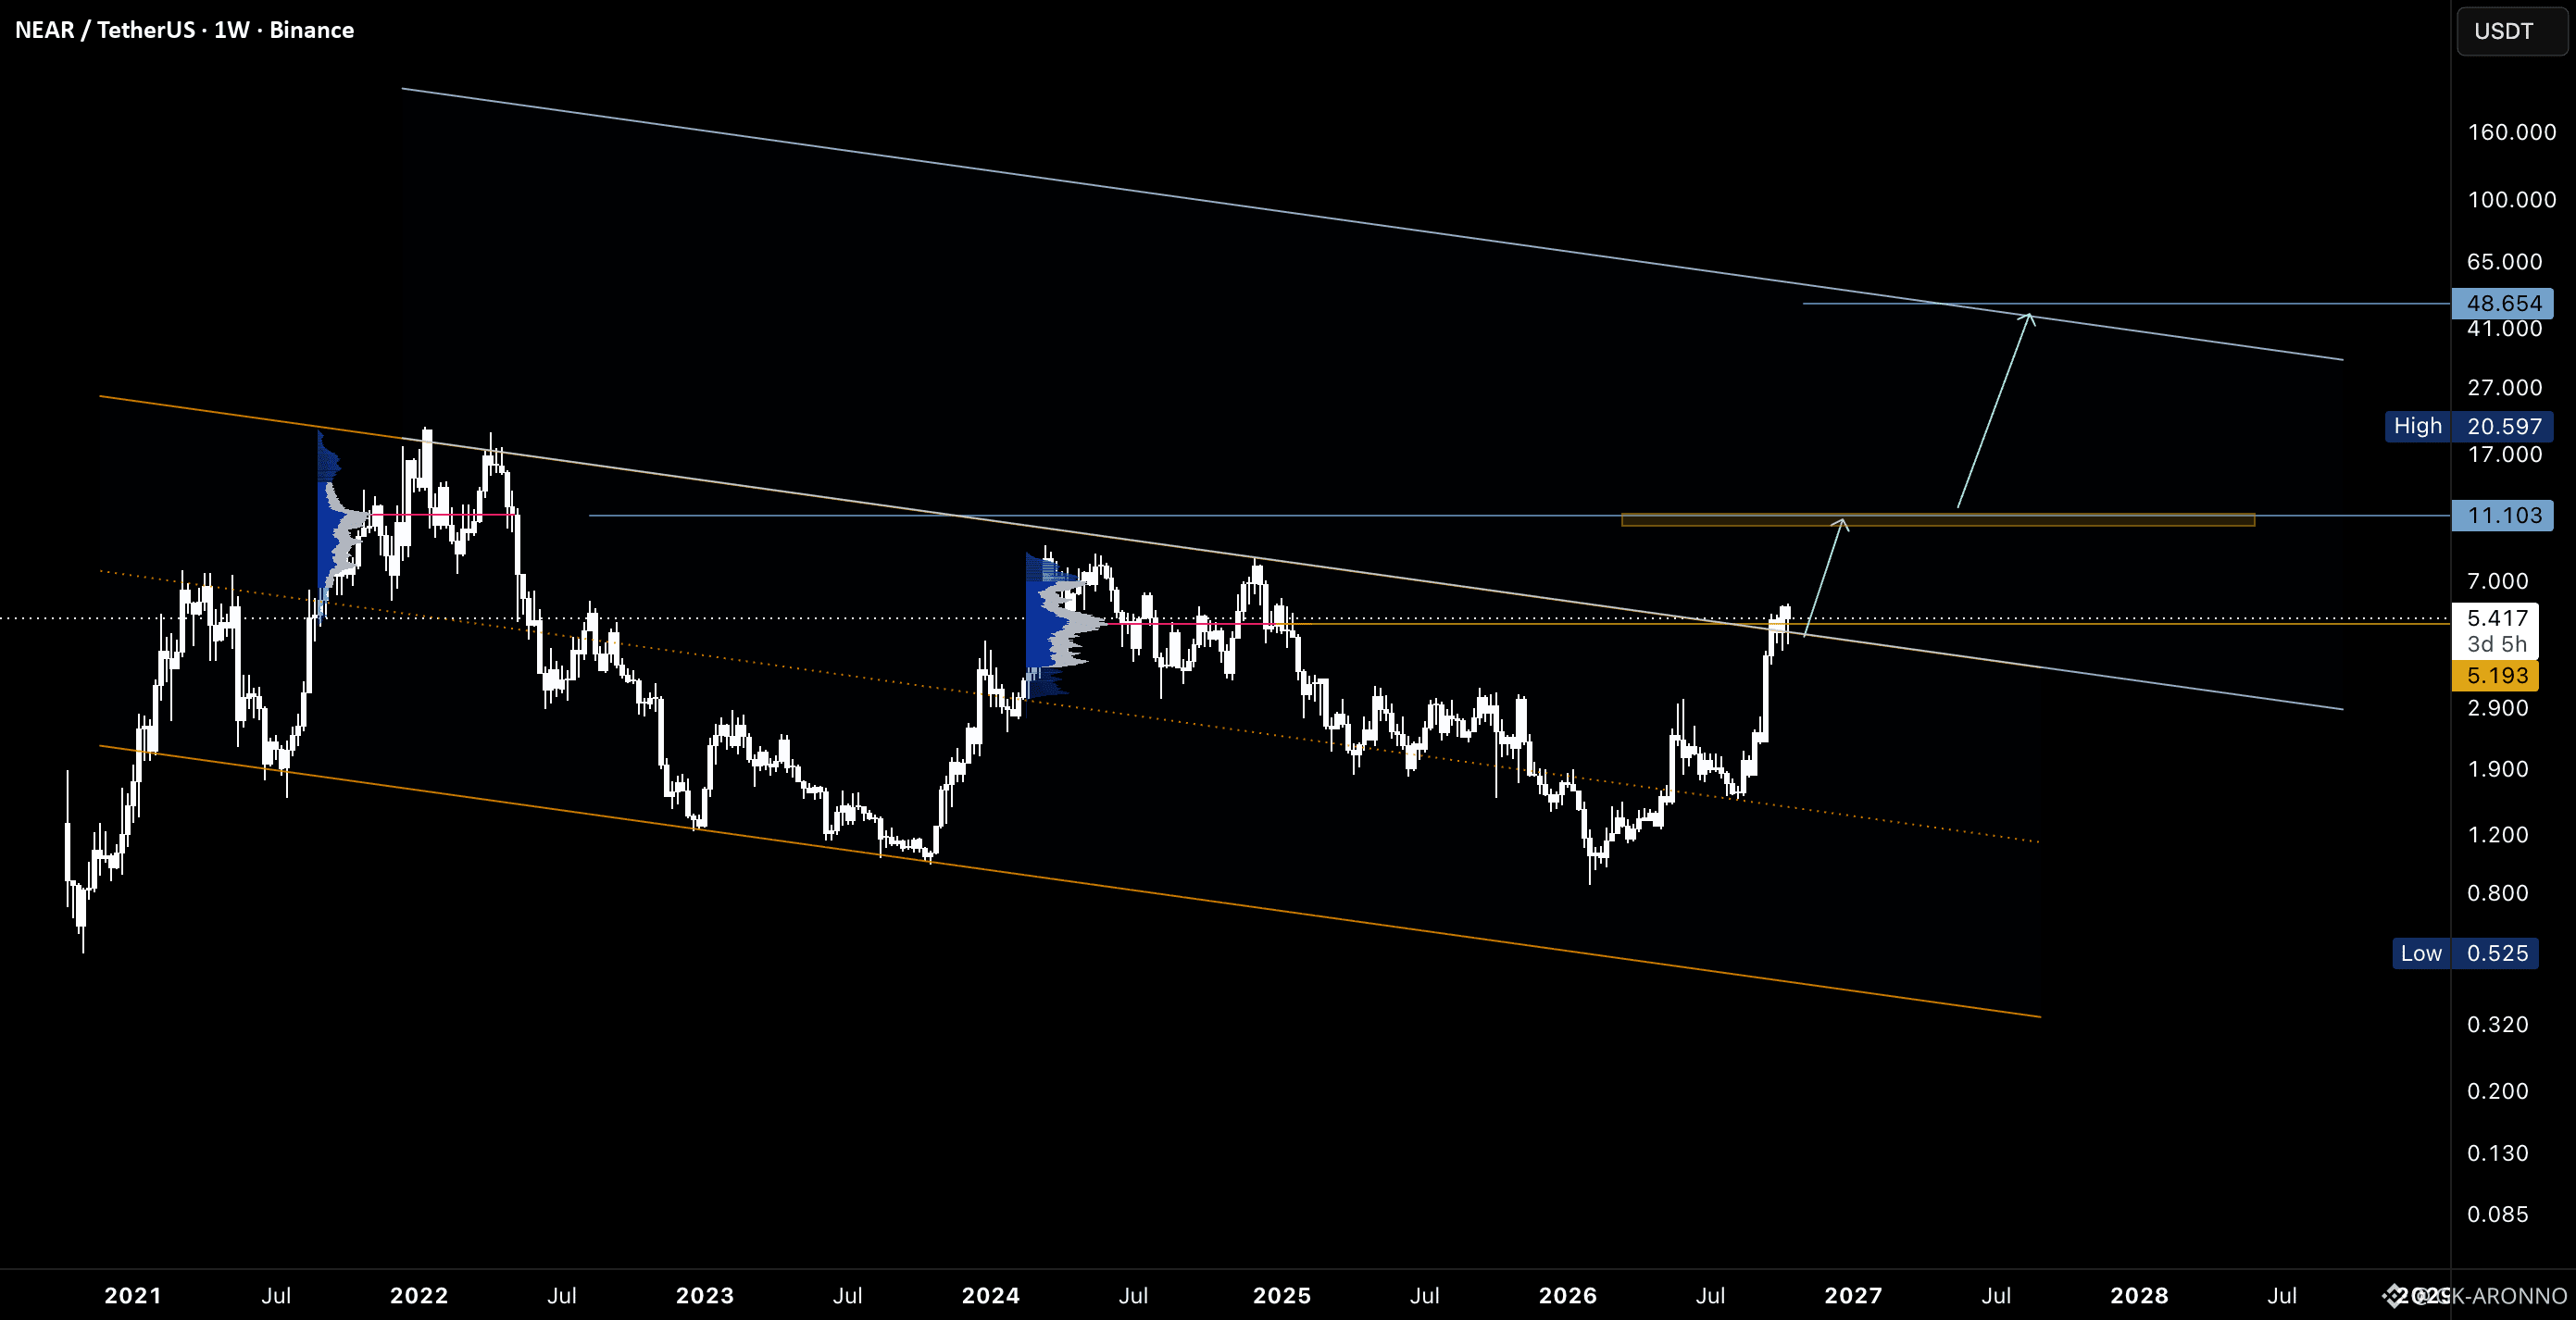
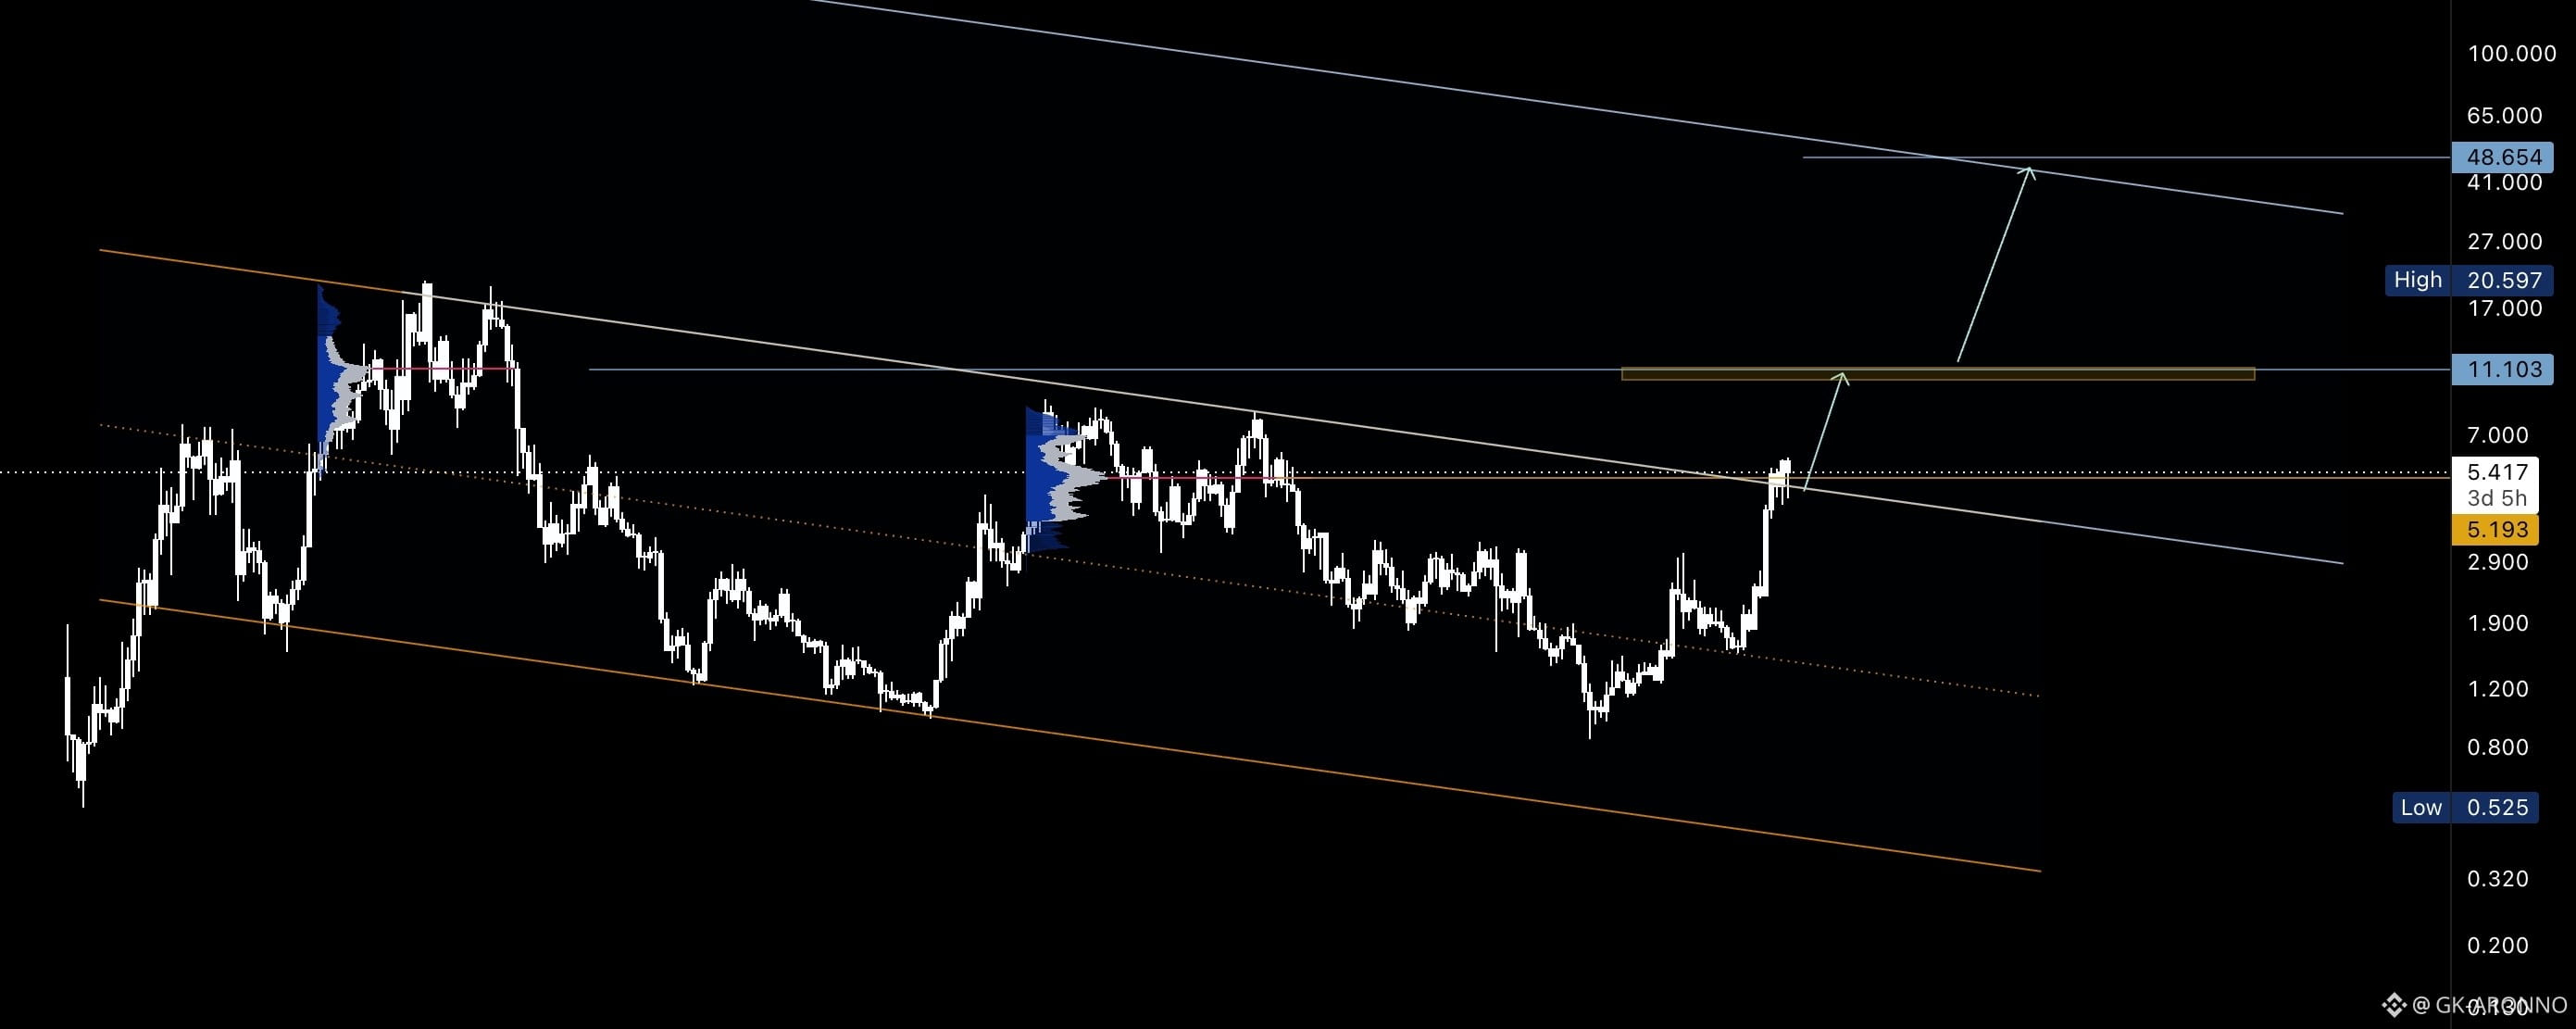
NEAR (1W, log scale) is breaking out of the descending channel that has defined price action since the 2022 top, and the weekly candle is now pushing above the upper boundary.
What the chart shows:
After the 2022 high (~20.6), price spent years in a descending channel, bottoming around the 0.9 area in early 2026.
Since that low, price has risen sharply and is now trading at ~5.4, above the channel’s upper trendline.
The breakout is happening at the 2024 volume profile POC (~5.2), so the trendline and a high-volume level are being reclaimed together.
Above price, the next major reference is the 2021-22 volume profile POC at ~11.1, which is also my first target.
Targets:
TP1: ~11.1. The 2021-22 POC and the gold supply zone. I expect a strong reaction here, so partial profits make sense.
TP2: ~48.6. The projected target of the channel breakout. This is a long-term target well above the previous all-time high, so it’s a map of where the structure points, not a short-term expectation.
Confirmation and invalidation:
The current weekly candle is not closed yet. A weekly close above the trendline and ~5.2, ideally followed by a successful retest, would confirm the breakout.
A weekly close back below ~5.2 and inside the channel would turn this into a failed breakout. The next support would then be the ~2.9 area.
Note:
Breakouts on high timeframes often retest before continuing, so I’d rather scale in around the retest than chase. Define your risk before you enter.
*Not financial advice. If you found this useful, a like and a follow help. 🚀