


Cardano, Bitcoin, and Ethereum recovered from their early October 13 lows, but their rebounds face a similar test. Each asset remains below resistance that could limit further recovery, and the supplied indicator readings show different levels of buyer strength.
Today’s crypto price prediction examines whether these recoveries can develop into stronger moves or remain within familiar ranges. Cardano’s indicators lean bearish, Bitcoin presents a more balanced picture, and Ethereum has conflicting signals near an important resistance area.
Cardano Price Recovery Faces Resistance Near $0.256
Cardano price dropped to around $0.224 earlier this morning before recovering to approximately $0.239. That bounce established $0.224 as an immediate support reference, although ADA still needs to clear resistance around $0.256 to $0.257.
The current setup leaves room for movement between those boundaries. A sustained breakout above $0.257 could open a path toward $0.283 over the coming trading sessions. A loss of $0.224 would weaken the recovery and bring $0.21 into view.
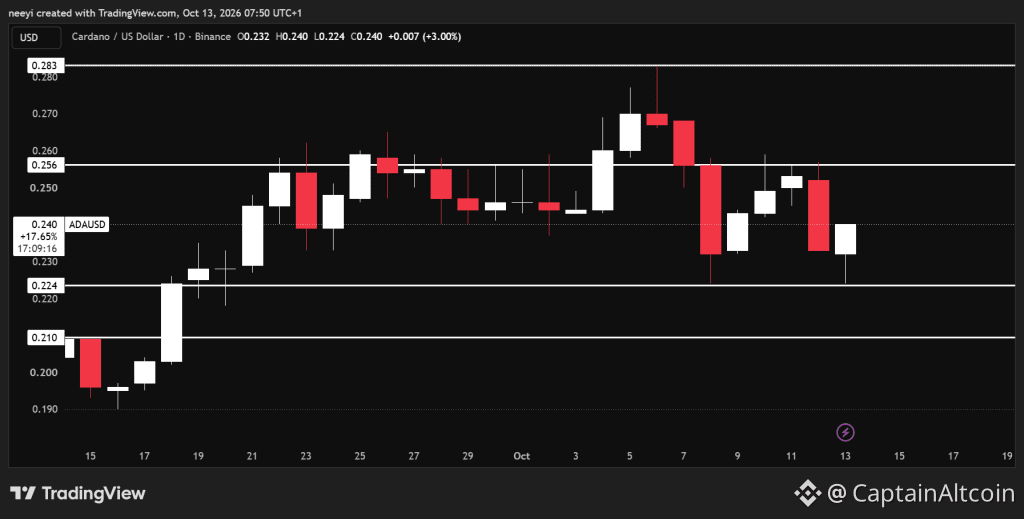 ADA Price Chart / TradingView.com
The supplied readings help explain why a rebound alone does not confirm stronger buying pressure.
RSI at 42.221 remains below the midpoint of 50. That reading indicates weaker recent upward momentum and supports caution about Cardano’s ability to reach resistance without another improvement in demand.
Stochastic at 28.542 places ADA toward the lower end of its recent price range. The reading is above the usual oversold threshold of 20, so it does not establish that selling pressure has reached exhaustion.
MACD at negative 0.003 supports the bearish assessment. The negative value indicates that the shorter moving average remains below the longer moving average, despite the price recovery.
Ultimate Oscillator at 47.190 adds another below midpoint reading. Buying pressure across its measured periods remains relatively weak, which fits a recovery that could struggle before $0.257.
Indicator Value Action And Brief Explanation RSI (14) 42.221 Sell bias: Upward momentum remains below the midpoint. Stochastic (9,6) 28.542 Sell bias: Price remains near its recent lower range. MACD (12,26) −0.003 Sell bias: Shorter average remains below longer average. Ultimate Oscillator 47.190 Sell bias: Buying pressure remains below the midpoint.
Cardano Price Prediction for Today
Bullish Scenario: ADA holds its recovery and clears $0.257 with sustained buying pressure. That would improve the case for $0.283 over subsequent sessions.
Neutral Scenario: Cardano price remains between $0.224 and $0.257 as buyers and sellers fail to force a decisive breakout.
Bearish Scenario: ADA falls below $0.224 and fails to reclaim support. The next downside reference would be approximately $0.21.
Bitcoin Price Rebound Tests the $84,200 Range Ceiling
Bitcoin price recovered from around $80,900 earlier this morning to approximately $83,500. BTC now trades closer to the upper boundary of its stated $80,900 to $84,200 range.
A sustained move above $84,200 could create room toward $86,000, followed by $87,000 over the coming sessions. The downside requires close attention to the range floor. A break below $80,900, followed by further weakness beneath $80,800, could expose $78,000.
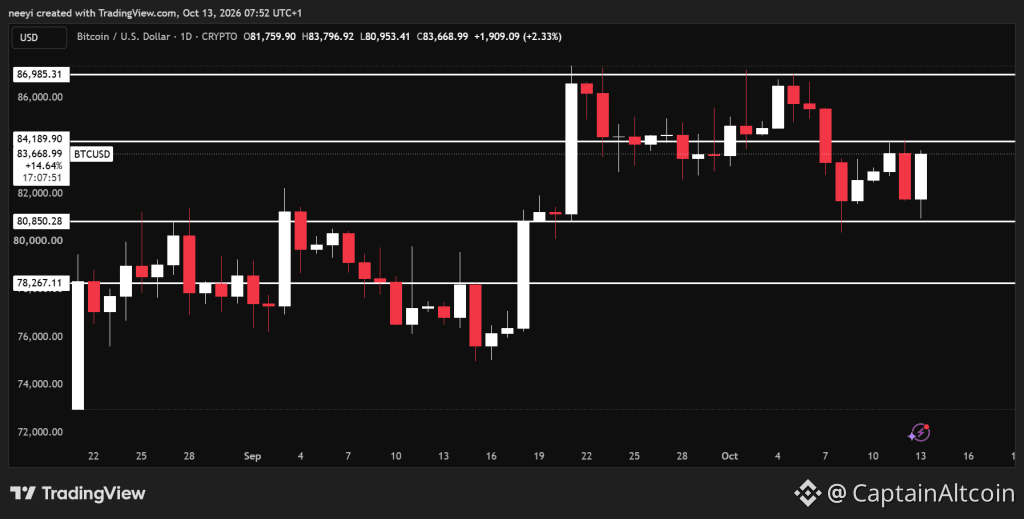 BTC Price Chart / TradingView.com
Bitcoin’s indicators offer stronger support for its rebound than Cardano’s readings, although they do not agree completely.
RSI at 54.130 gives buyers a modest momentum advantage. The supplied neutral classification remains reasonable because the reading is only slightly above 50 and does not establish a powerful upward trend.
Stochastic at 50.754 places Bitcoin near the middle of its recent range. This supports a balanced assessment and leaves room for movement toward either boundary.
MACD at negative 104.841 remains the main bearish reading. Bitcoin’s recovery has not moved the shorter average above the longer average measured by this indicator.
Ultimate Oscillator at 52.653 provides a modest positive reading. Buying pressure has improved, but the distance above 50 remains limited.
Bull/Bear Power at positive 809.8447 supports the recovery because price strength extends above the indicator’s reference average. That positive reading helps explain the rebound but does not guarantee a breakout above $84,200.
Indicator Value Action And Brief Explanation RSI (14) 54.130 Neutral: Buyers hold a modest momentum advantage. Stochastic (9,6) 50.754 Neutral: Price occupies its recent middle range. MACD (12,26) −104.841 Sell bias: The underlying momentum reading remains negative. Ultimate Oscillator 52.653 Buy bias: Buying pressure holds slightly above midpoint. Bull/Bear Power (13) 809.8447 Buy bias: Positive reading supports current buyer strength.
Bitcoin Price Prediction for Today
Bullish Scenario: BTC breaks above $84,200 and maintains that level. The next recovery targets become $86,000 and $87,000 over subsequent sessions.
Neutral Scenario: Bitcoin price continues between $80,900 and $84,200 without a sustained move beyond either boundary.
Bearish Scenario: BTC loses $80,900 and extends below $80,800. That would increase the possibility of a deeper move toward $78,000.
Ethereum Price Recovery Needs a Break Above $2,600
Ethereum price recovered from approximately $2,400 earlier this morning to around $2,520. Its broader stated range remains $2,300 to $2,600, which places the current recovery beneath an important ceiling.
A sustained break above $2,600 could support a move toward $2,700. Failure to clear resistance could keep ETH within the broader range. A breakdown beneath $2,300 would bring $2,250 into consideration.
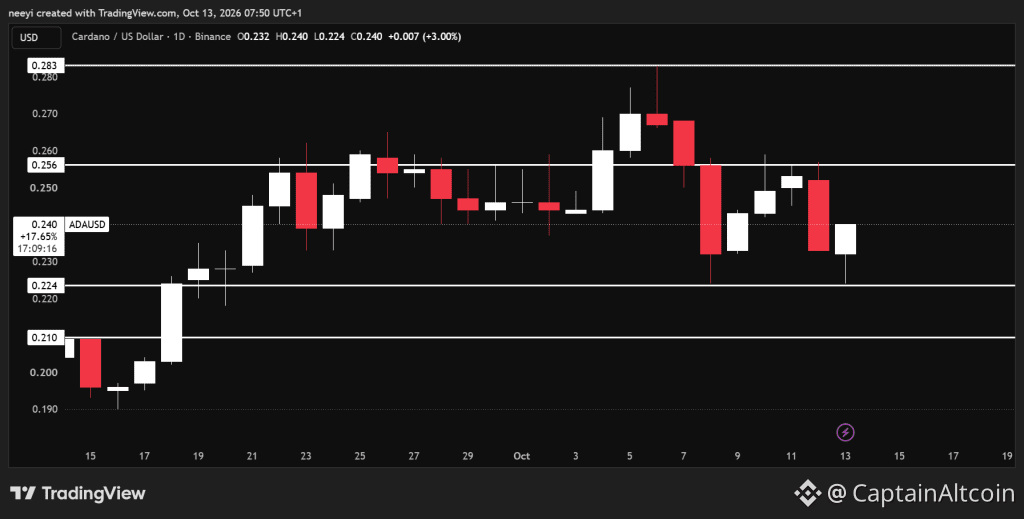 ETH Price Chart / TradingView.com
RSI at 48.489 indicates relatively balanced momentum with a slight bearish lean. Ethereum needs further improvement before this measure provides clearer support for higher prices.
Stochastic at 42.513 remains below its midpoint. That fits the supplied sell classification, although the reading alone does not confirm an imminent decline.
MACD at negative 15.971 adds bearish pressure to the assessment. The rebound has not reversed the relationship between its shorter and longer moving averages.
Ultimate Oscillator at 53.561 provides the positive counterweight. Buying pressure is slightly stronger across its measured periods, but ETH still needs price confirmation above $2,600.
Indicator Value Action And Brief Explanation RSI (14) 48.489 Neutral: Momentum remains close to the midpoint. Stochastic (9,6) 42.513 Sell bias: Price strength remains below midpoint. MACD (12,26) −15.971 Sell bias: The momentum reading remains negative. Ultimate Oscillator 53.561 Buy bias: Buying pressure holds modestly above midpoint.
Ethereum Price Prediction for Today
Bullish Scenario: ETH clears $2,600 and maintains the breakout. That could support an extension toward $2,700 in subsequent sessions.
Neutral Scenario: Ethereum price remains between $2,300 and $2,600 as conflicting indicator readings persist.
Bearish Scenario: ETH breaks below $2,300 and fails to recover that level. The next downside reference becomes approximately $2,250.
FAQs
Is ETH better than Bitcoin?
Neither Ethereum (ETH) nor Bitcoin (BTC) is universally “better”—they are designed for different purposes and fill separate roles in digital finance.
Is Ethereum faster than BTC?
Yes, Ethereum is faster than Bitcoin in both block time and transaction throughput.
Subscribe to our YouTube channel for daily crypto updates, market insights, and expert analysis.
The post Crypto Price Prediction for Today, October 13: Cardano (ADA), Bitcoin (BTC), Ethereum (ETH) appeared first on CaptainAltcoin.