


Pyth Network (PYTH) is showing an interesting technical setup. According to the latest Binance screenshots, PYTH/USDT is trading around $0.08254, up approximately 4.45%–4.47%, with 24-hour trading volume of around 195.51 million PYTH.
The daily chart remains strong, but the 1-hour chart suggests that short-term buyers still need to regain control.
Will PYTH break toward $0.09082 again, or will resistance trigger another pullback?
Let's examine the chart levels, moving averages, volume and possible scenarios.
📈 1. The 1-Hour Chart: Buyers Need Confirmation
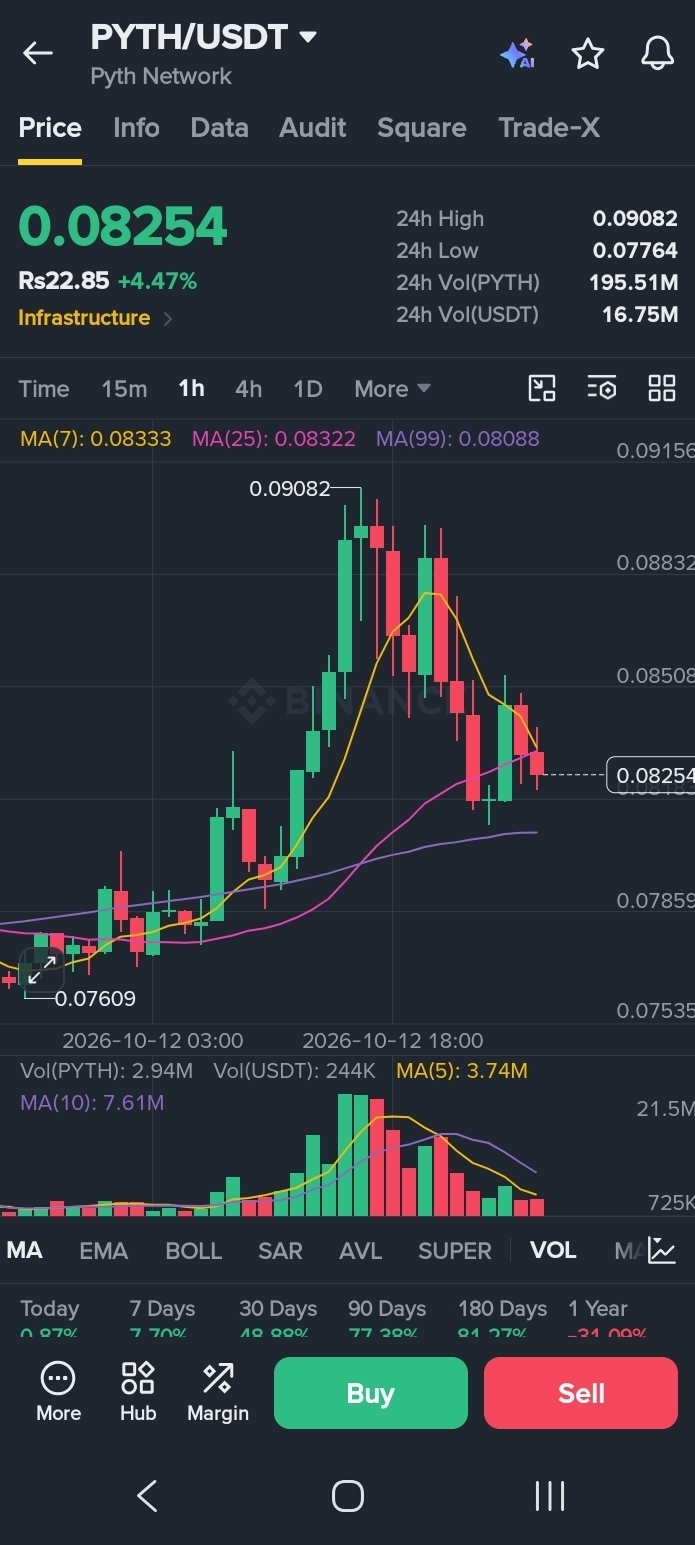
The 1-hour moving averages are:
MA(7): $0.08333
MA(25): $0.08322
MA(99): $0.08088
PYTH is currently trading below MA(7) and MA(25), suggesting that short-term momentum has cooled after the recent move.
However, the price remains above MA(99), which is an important level to watch.
The hourly volume shown in the screenshot is approximately 2.94 million PYTH, below the displayed MA(5) of 3.74 million and MA(10) of 7.61 million. This means a stronger move would benefit from renewed trading activity.
What matters next: Can PYTH reclaim the $0.08322–$0.08333 zone and hold above it?
📅 2. The Daily Chart: The Broader Trend Remains Strong
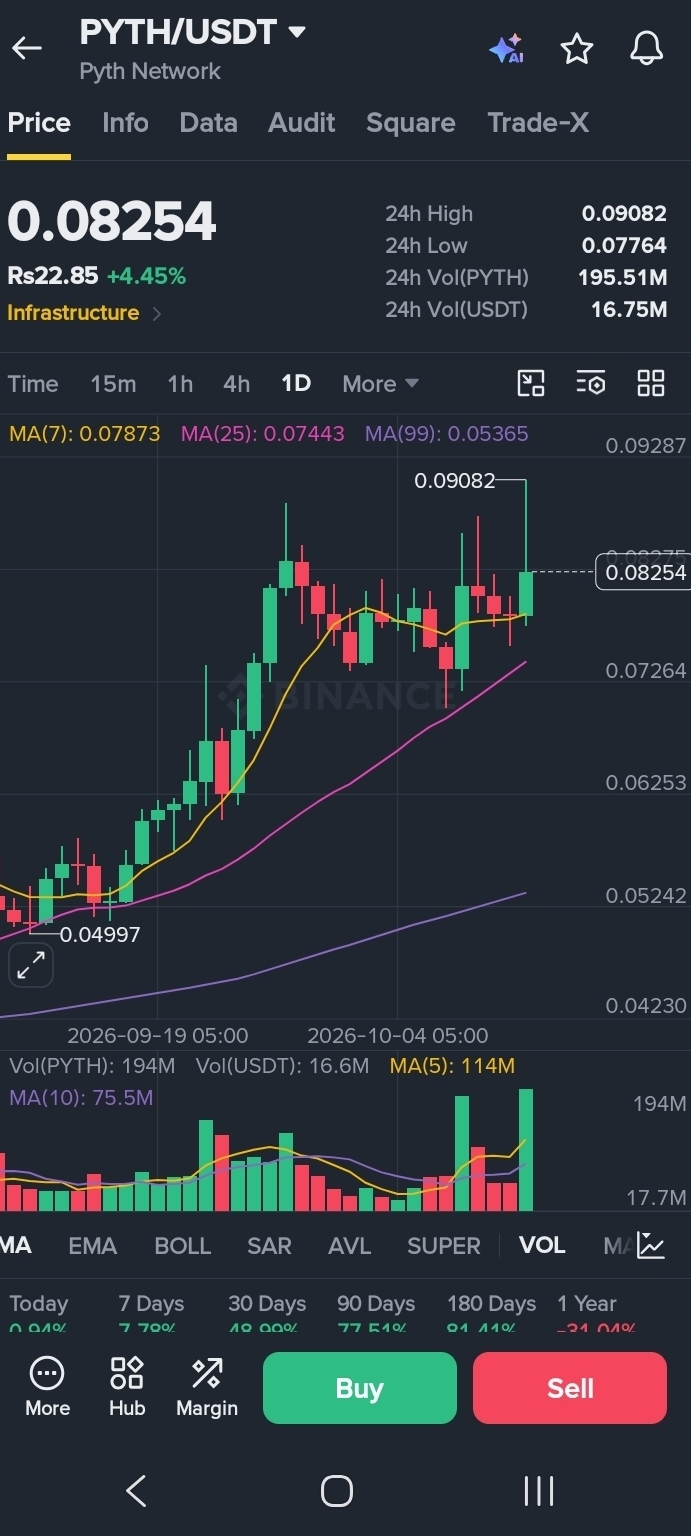
The daily moving averages show a more constructive picture:
MA(7): $0.07873
MA(25): $0.07443
MA(99): $0.05365
PYTH is trading above all three daily moving averages. This supports the view that the broader trend has strengthened compared with its earlier price levels.
The daily screenshot also shows approximately 194 million PYTH in volume, above the displayed MA(5) of 114 million and MA(10) of 75.5 million.
That elevated activity is worth monitoring, although volume alone cannot tell us whether buyers or sellers will dominate next.
🎯 3. Key Support and Resistance Levels
Based on the price levels visible in the screenshots:
Resistance zones
$0.08322–$0.08333: First hurdle, around the hourly moving averages.
$0.08508: Next resistance area visible on the hourly chart.
$0.08832: Higher resistance to watch.
$0.09082–$0.09156: Major recent-high resistance zone.
Support zones
$0.08088: Hourly MA(99), an important near-term reference.
$0.07859–$0.07764: Lower support area, including the reported 24-hour low.
$0.07609: Additional chart support.
$0.07535: A lower level to watch if selling pressure increases.
These are observation zones, not guaranteed turning points.
🚀 4. Bullish Scenario: What Could Trigger Another Move Up?
If PYTH reclaims $0.08333 and holds above that area, a move toward $0.08508 could become possible.
A convincing breakout above $0.08508, supported by improving volume, could open the way toward $0.08832.
The $0.09082–$0.09156 area remains the more significant test. Buyers would need to overcome that resistance before a stronger continuation could be considered.
A breakout should ideally be confirmed by candle closes and a successful retest—not just a brief price spike.
⚠️ 5. Bearish Scenario: Where Could the Recovery Weaken?
If PYTH repeatedly fails near $0.08322–$0.08333, the price could revisit $0.08088.
A break below that level could bring $0.07859–$0.07764 into focus. If selling pressure continues, $0.07609 and $0.07535 become further downside reference points.
The daily trend may remain stronger than the hourly trend, but that does not prevent a deeper short-term correction.
🧠 Final Verdict: PYTH Is Worth Watching, but Don't Chase the Candle
PYTH currently presents two different signals:
Daily chart: Price is above all three displayed moving averages.
Hourly chart: Price remains below MA(7) and MA(25), indicating that short-term momentum needs confirmation.
Volume: Daily activity is elevated relative to the displayed averages, while hourly volume is currently below its displayed averages.
My view is to watch the $0.08322–$0.08333 zone first. A recovery above it, supported by stronger volume, would improve the bullish case. Failure to reclaim it could leave PYTH vulnerable to another pullback.
What do you think? Can PYTH challenge $0.09082 again, or will resistance push the price lower? Share your chart view below. 👇
Disclaimer: This article is for educational and informational purposes only, not financial advice. Prices and technical levels are based on the supplied Binance screenshots and may change quickly. Always verify the latest market data, conduct your own research, and manage risk before trading.
#PYTH #PythNetwork #PYTHUSDT #CryptoAnalysis #TechnicalAnalysis #BinanceSquare #Altcoins #CryptoMarket #priceaction