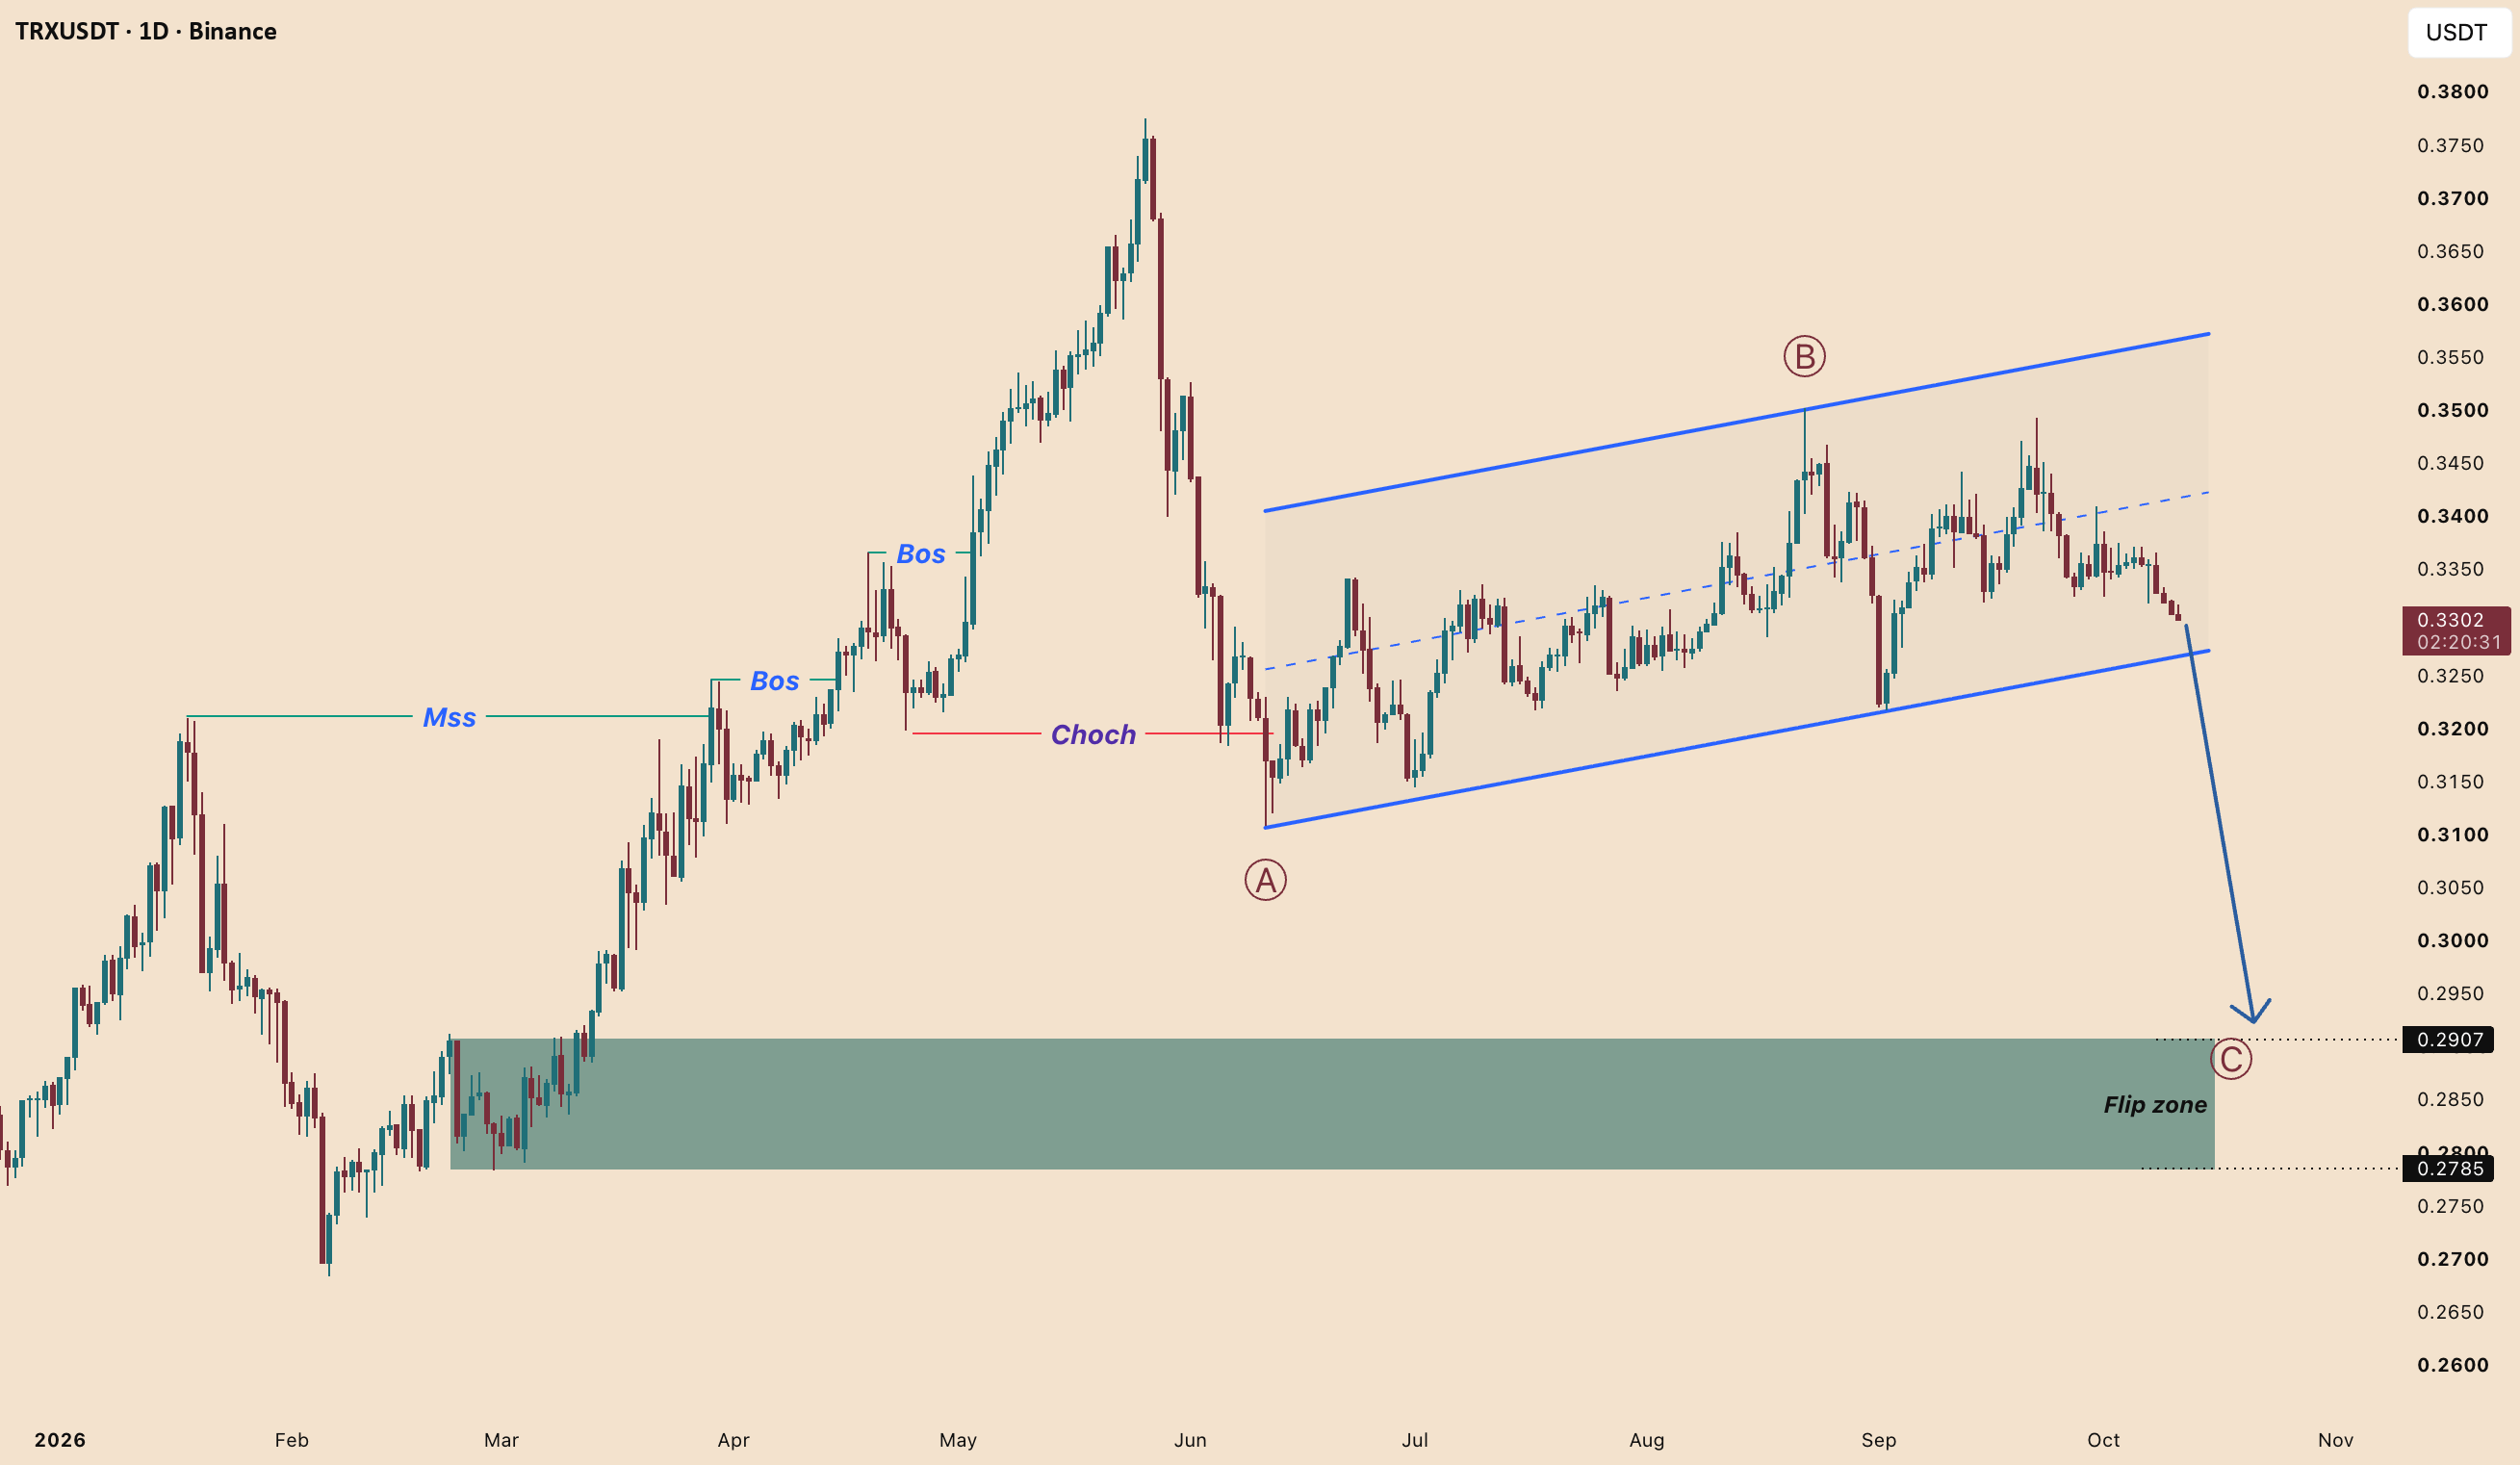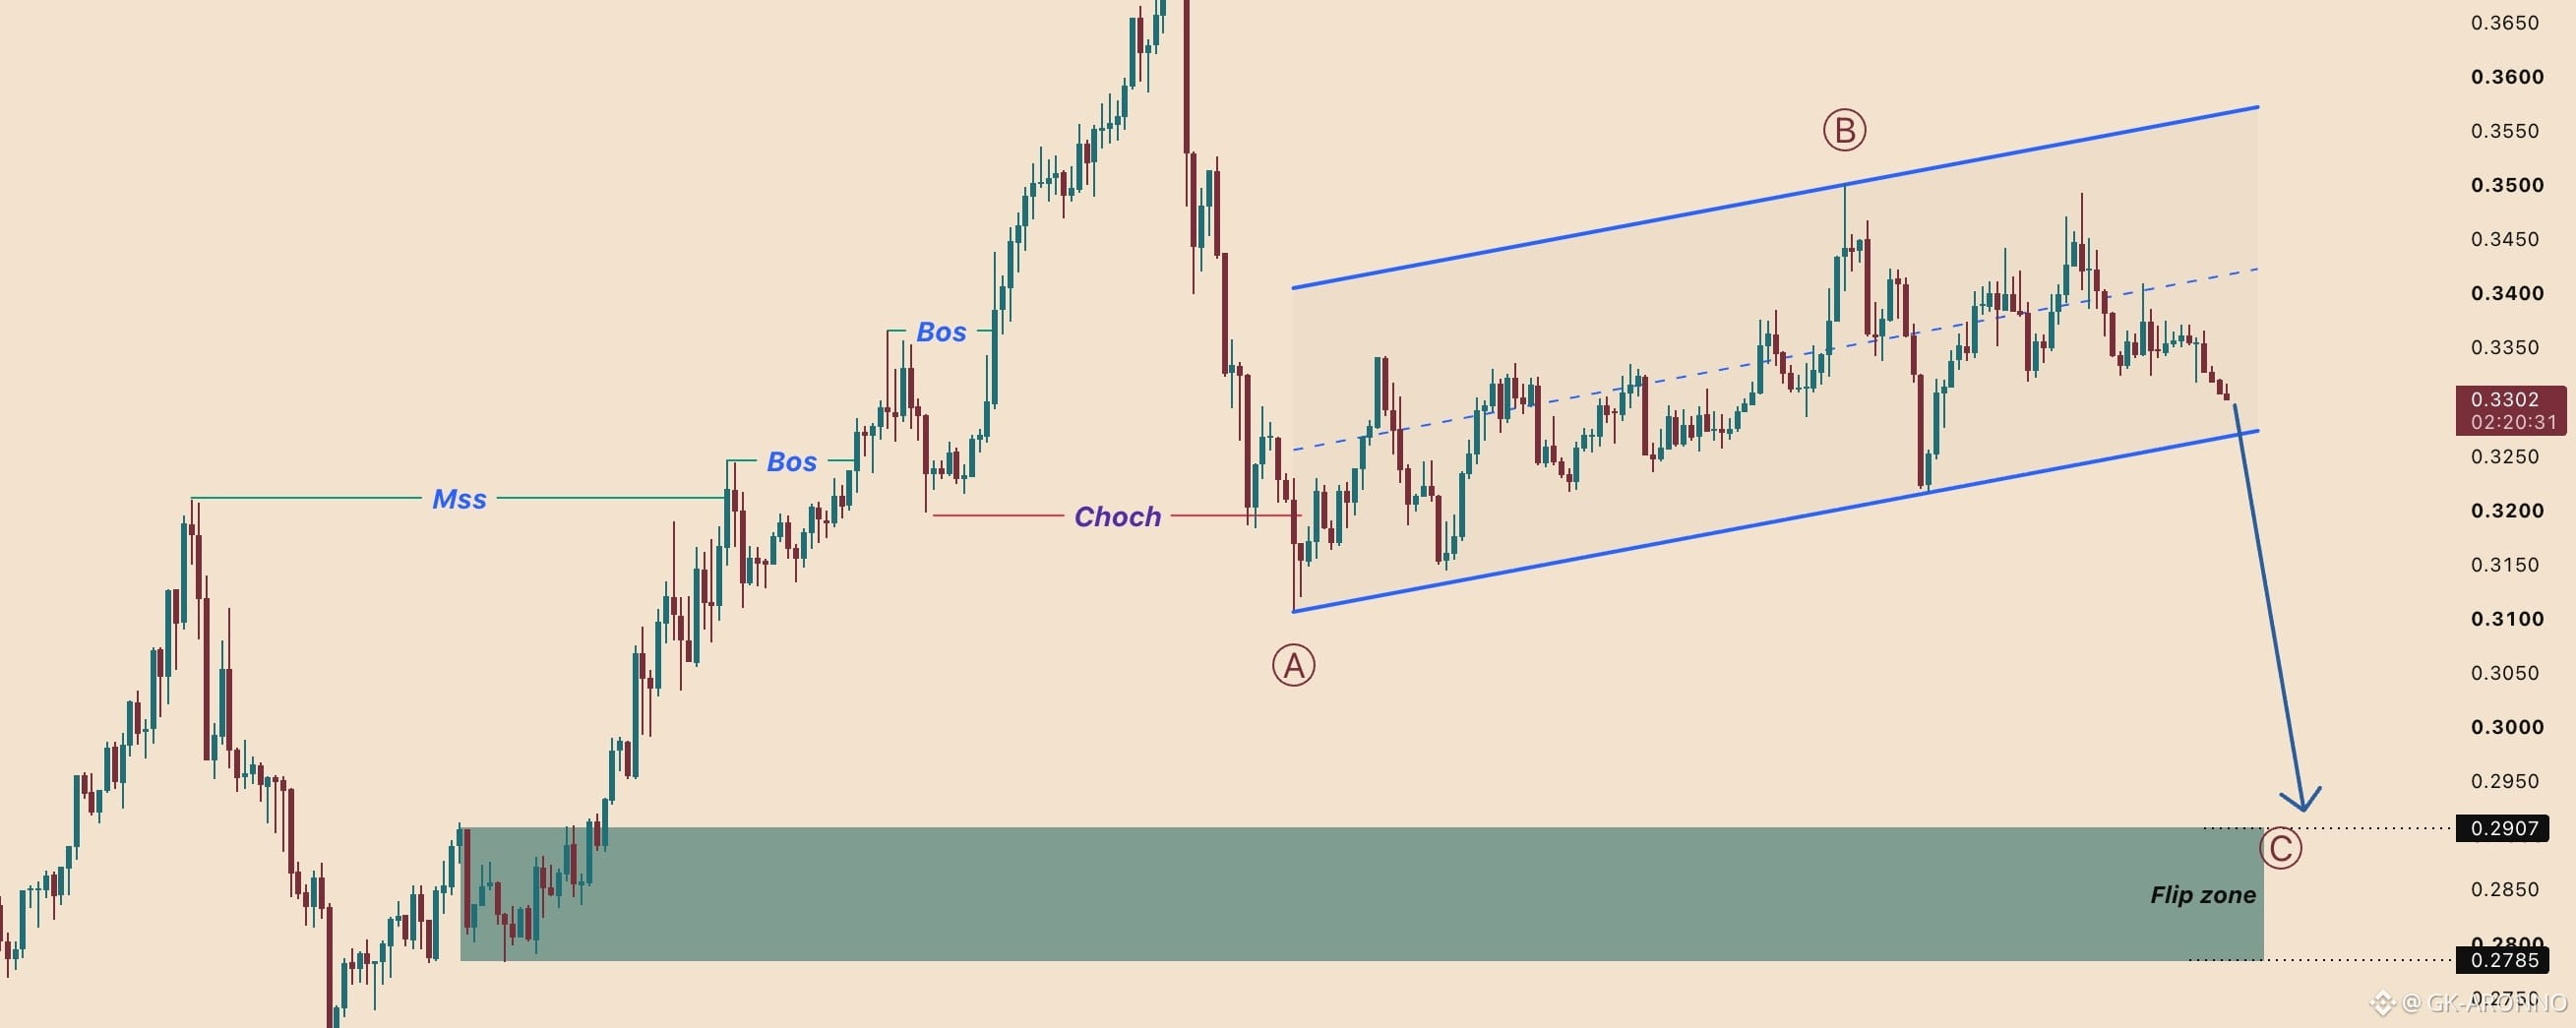


By analyzing the #TRX (TRON) chart on the Daily timeframe, we can see a market that broke its bullish structure in June and has spent four months building a corrective pattern that is now close to its final leg.
━━━━━━━━━━━━━━━━━━━━
DAILY TIMEFRAME
━━━━━━━━━━━━━━━━━━━━
The uptrend. The move began with the MSS in February and was confirmed by two BOS events through March and April, carrying price from $0.2700 to the May high at $0.3760.
The break. That ended in June. The CHoCH near $0.3200 took out the structure that had held the entire advance — the first signal the trend had changed rather than paused.
The correction. What followed is a three-wave structure, not a reversal and not a continuation.
(A) — the drop from $0.3760 into the June low at $0.3100.
(B) — a long, sideways grind higher inside a rising channel, topping at $0.3500 in late August.
That channel is the shape that matters. Four months of overlapping candles drifting upward on a shallow slope is not accumulation — it is a corrective wave that has been running out of momentum since September. Price is now at $0.3302, pressed against the lower boundary.
━━━━━━━━━━━━━━━━━━━━
THE KEY LEVELS
━━━━━━━━━━━━━━━━━━━━
Flip Zone — $0.2785 – $0.2907
The resistance that capped price through February and March, broken in April and never retested since. The only untested demand beneath price and the natural destination for wave (C).
Wave (B) High — $0.3500
The top of the corrective channel. The level that ends this count.
Channel Lower Boundary
Currently running just beneath price. The trigger.
━━━━━━━━━━━━━━━━━━━━
THE BIAS
━━━━━━━━━━━━━━━━━━━━
Bearish toward the Flip Zone while price stays beneath $0.3500.
━━━━━━━━━━━━━━━━━━━━
SCENARIO A — THE BASE CASE
━━━━━━━━━━━━━━━━━━━━
Price breaks the lower boundary of the rising channel on a daily close and wave (C) begins. Target is the Flip Zone at $0.2785 – $0.2907.
The structure is clean because of what is not there: between current price and the top of that zone there is no order block, no untested demand, nothing price has to work through. Wave C legs move quickly through empty ranges, and this one is empty.
━━━━━━━━━━━━━━━━━━━━
SCENARIO B — THE EXTENDED (B)
━━━━━━━━━━━━━━━━━━━━
Price holds the channel and pushes once more toward $0.3500 before rolling over. The destination does not change — it just takes longer and offers a better entry at the top of the range.
What matters is that it stays beneath $0.3500. A higher high inside the channel is still wave (B) behaving as wave (B).
━━━━━━━━━━━━━━━━━━━━
INVALIDATION
━━━━━━━━━━━━━━━━━━━━
A daily close above $0.3500. Above the wave (B) high the three-wave reading is wrong — the structure would be impulsive rather than corrective, and the June CHoCH would have been a failed break.
And the rule that governs all of it: a break is a candle close, not a wick. The channel's lower boundary is where this starts, and price has touched it several times already without closing beneath. Each of those was noise. The one that closes is