

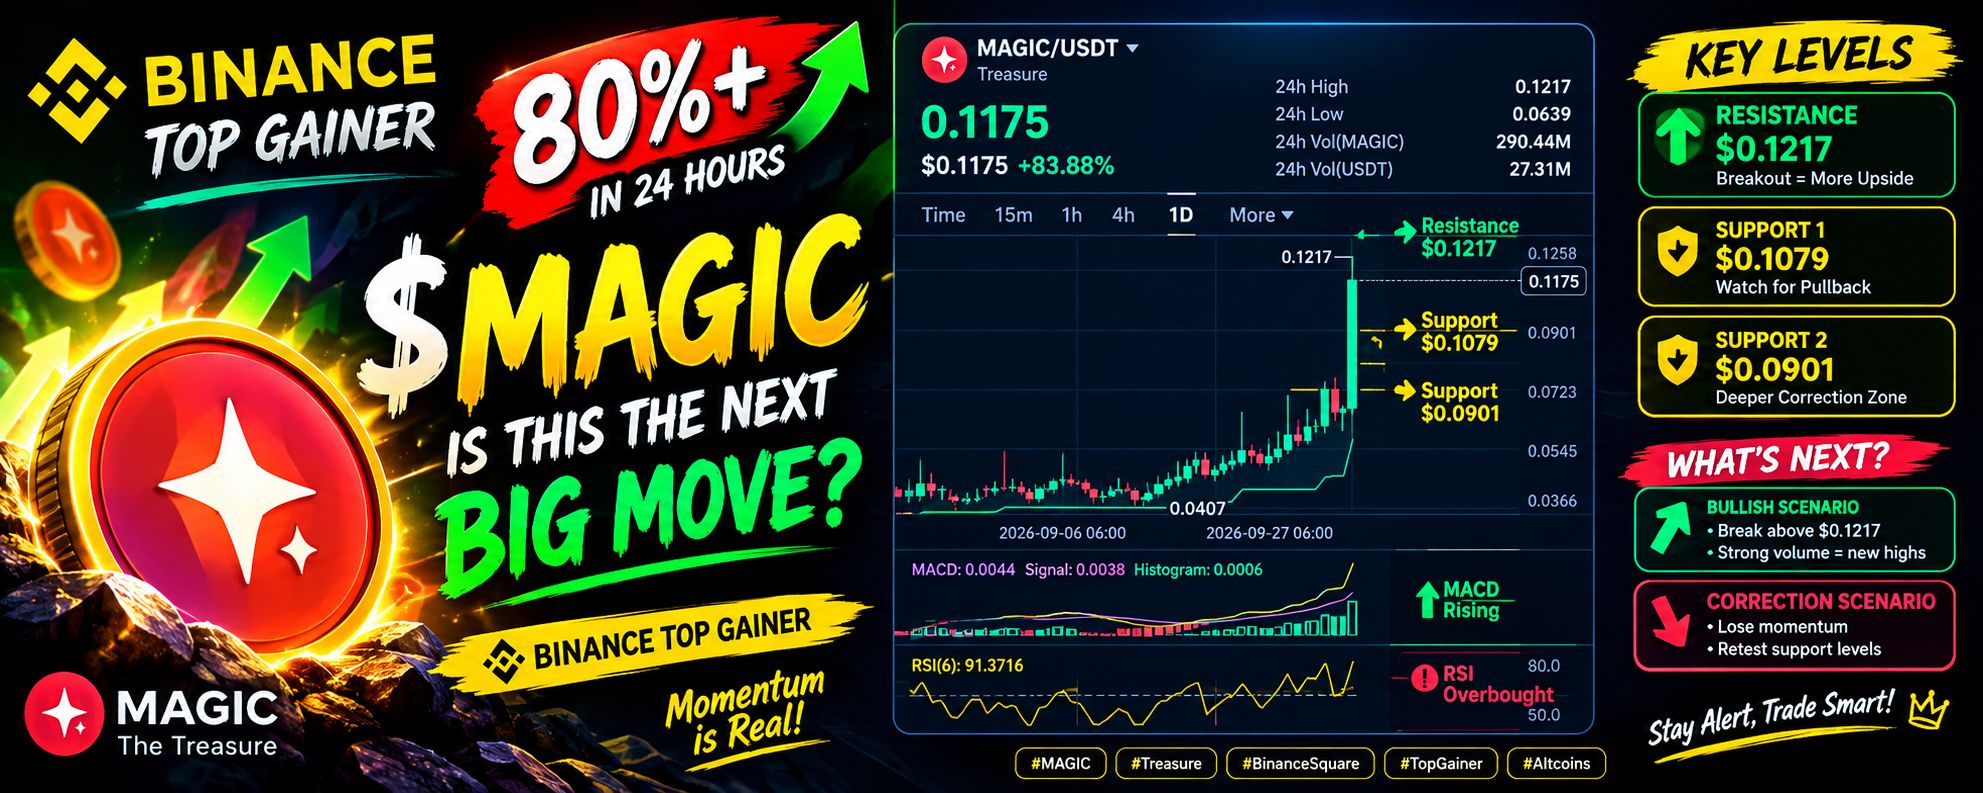

The Treasure $MAGIC chart is catching serious attention today! 👀💚
According to the chart snapshot, **$MAGIC is trading around $0.1175, up an incredible 83.88% in 24 hours**, with a high of $0.1217. Binance market data is also showing a powerful rally in MAGIC. 📈
But here’s the BIG question: **Is this the beginning of another leg up, or is a correction coming after this massive pump?**
📊 **TECHNICAL BREAKDOWN**
🟢 **Bullish Momentum:** A huge daily candle and rising MACD indicate strong recent buying pressure.
🔥 **Key Resistance:** $0.1217
A convincing breakout above this level, supported by strong volume, could open the door to further upside.
🟡 **Potential Support Areas:** $0.1079 and $0.0901
These are chart reference levels to watch if the price pulls back. They are not guaranteed support zones.
⚠️ **RSI WARNING:** RSI(6) is around 91.37 on the screenshot, indicating extremely overbought short-term momentum. A sharp rally like this can attract profit-taking and sudden volatility.
🎯 **WHAT COULD HAPPEN NEXT?**
✅ **Bullish scenario:** MAGIC breaks above $0.1217 with strong volume and sustains the breakout.
🔻 **Correction scenario:** Buyers lose momentum, and the price retraces toward lower support areas.
💎 **My view:** MAGIC is showing exceptional momentum, but chasing a coin after an 80%+ surge carries significant risk. Watch for confirmation, volume, and a possible retest before making any trading decision.
💬 **COMMUNITY QUESTION:** Can $MAGIC break above $0.1217 and continue its rally, or will profit-taking take over? 👇
🔥 Drop your prediction in the comments: **BULLISH 🚀 or CORRECTION 📉?**