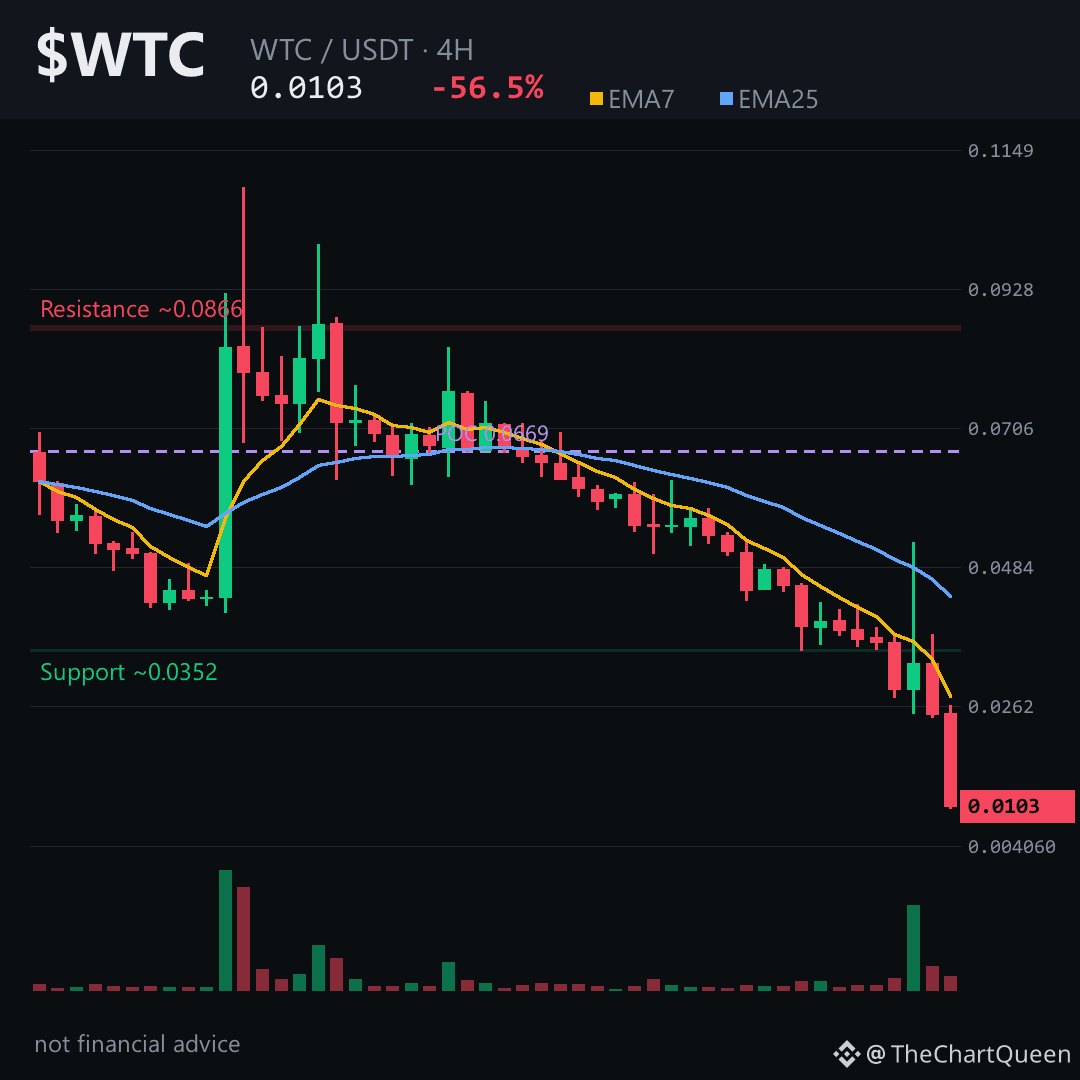
-56.54%.
That’s not a dip. That’s a structural break.
$WTC just printed its lowest 4-hour close on record — trading below every historical anchor. The daily shows an unfilled bearish gap overhead around 0.054–0.058. That’s not resistance. That’s a ceiling.
RSI on the 4H is pinned near 20. Oversold doesn’t mean bounce — it means the trend is still dictating. EMA7 is nearly half of EMA25. Price can’t even touch the short-term average. That’s sustained distribution, not a flush.
The key level on the 4H is ~0.0108. As long as $WTC stays below that, the path points toward 0.0094 — a level that was never support, just the next void. A 4H close back above 0.0108 and the read shifts. Until then, the chart is still falling through empty space.
My read: bounce attempts are getting shallower and sold faster. That’s not a base forming — that’s a market still looking for where value actually lives. Tap $WTC to pull up the chart and check the 4H structure yourself.
Follow me — if this floor finally holds, I’ll map where the next real level sits.
What’s the one level you’re watching on WTC right now 👇
⚠️ Not financial advice. DYOR.
#WTC #Crypto #BinanceSquare #Altcoins
That’s not a dip. That’s a structural break.
$WTC just printed its lowest 4-hour close on record — trading below every historical anchor. The daily shows an unfilled bearish gap overhead around 0.054–0.058. That’s not resistance. That’s a ceiling.
RSI on the 4H is pinned near 20. Oversold doesn’t mean bounce — it means the trend is still dictating. EMA7 is nearly half of EMA25. Price can’t even touch the short-term average. That’s sustained distribution, not a flush.
The key level on the 4H is ~0.0108. As long as $WTC stays below that, the path points toward 0.0094 — a level that was never support, just the next void. A 4H close back above 0.0108 and the read shifts. Until then, the chart is still falling through empty space.
My read: bounce attempts are getting shallower and sold faster. That’s not a base forming — that’s a market still looking for where value actually lives. Tap $WTC to pull up the chart and check the 4H structure yourself.
Follow me — if this floor finally holds, I’ll map where the next real level sits.
What’s the one level you’re watching on WTC right now 👇
⚠️ Not financial advice. DYOR.
#WTC #Crypto #BinanceSquare #Altcoins