

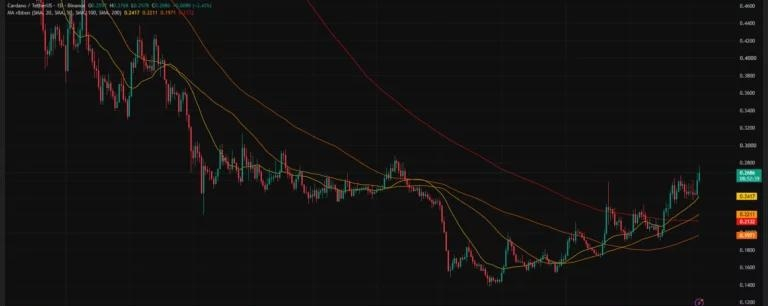

Cardano price traded near $0.269 on Oct. 5 after breaking above $0.26 and reaching $0.2768, while the $0.275–$0.28 are identified as the next resistance area and $0.264 as a possible pullback level.
TradingView’s $ADA /USDT daily chart placed Cardano at $0.2686, while the 4-hour chart recorded $0.2688. Both showed a high of $0.2768, followed by a retreat from the session’s peak.
The latest advance extended a recovery from roughly $0.14 in late June. On the daily chart, ADA has since moved through its longer-term moving averages and returned to price levels last seen around May.
Cardano clears $0.26 as daily money flow stays positive
TradingView’s daily chart showed ADA trading above its 20-day simple moving average at $0.2417, its 50-day average at $0.2211, its 100-day average at $0.1971 and its 200-day average at $0.2132.
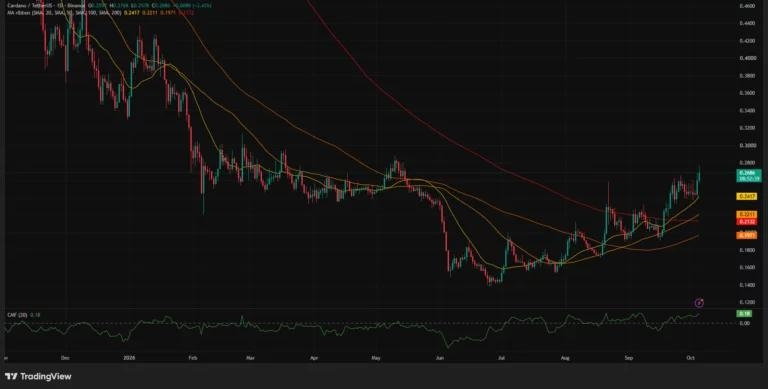
The 20-day average was above the other three readings, while the 50-day average also stood above the 200-day average. The 100-day average remained below the 200-day line, leaving the longer-term averages in a different order from the shorter-term pair.
At $0.2686, ADA traded about 11% above its 20-day average and 26% above its 200-day average. The daily price structure showed a sharp September advance followed by trading around $0.24–$0.26 before the latest push higher.
The same chart recorded Chaikin Money Flow at 0.18. A reading above zero indicates positive buying pressure under the indicator’s volume-based calculation, adding a positive money-flow signal to the move above the recent range.
The daily chart’s next visible historical price area sits around $0.28–$0.29, where ADA traded during earlier rallies in February, March, and May. The latest high of $0.2768 remained below that area.
Below the breakout, the daily chart placed the nearest tracked moving average at $0.2417. The 50-day and 200-day averages formed a lower reference area around $0.213–$0.221, with the 100-day average farther below at $0.1971.