



SpaceX (SPCX) was trading at $168.35 as of 11:06 ET on Monday, October 5, up 5.91% from the prior close of $158.96. The stock opened at $159.12, traded between a low of $158.67 and a high of $168.40, and was last at $168.35, against a previous close of $158.96. The daily, hourly and 15-minute readings all point bullish, though shorter timeframes now show an overbought tape.
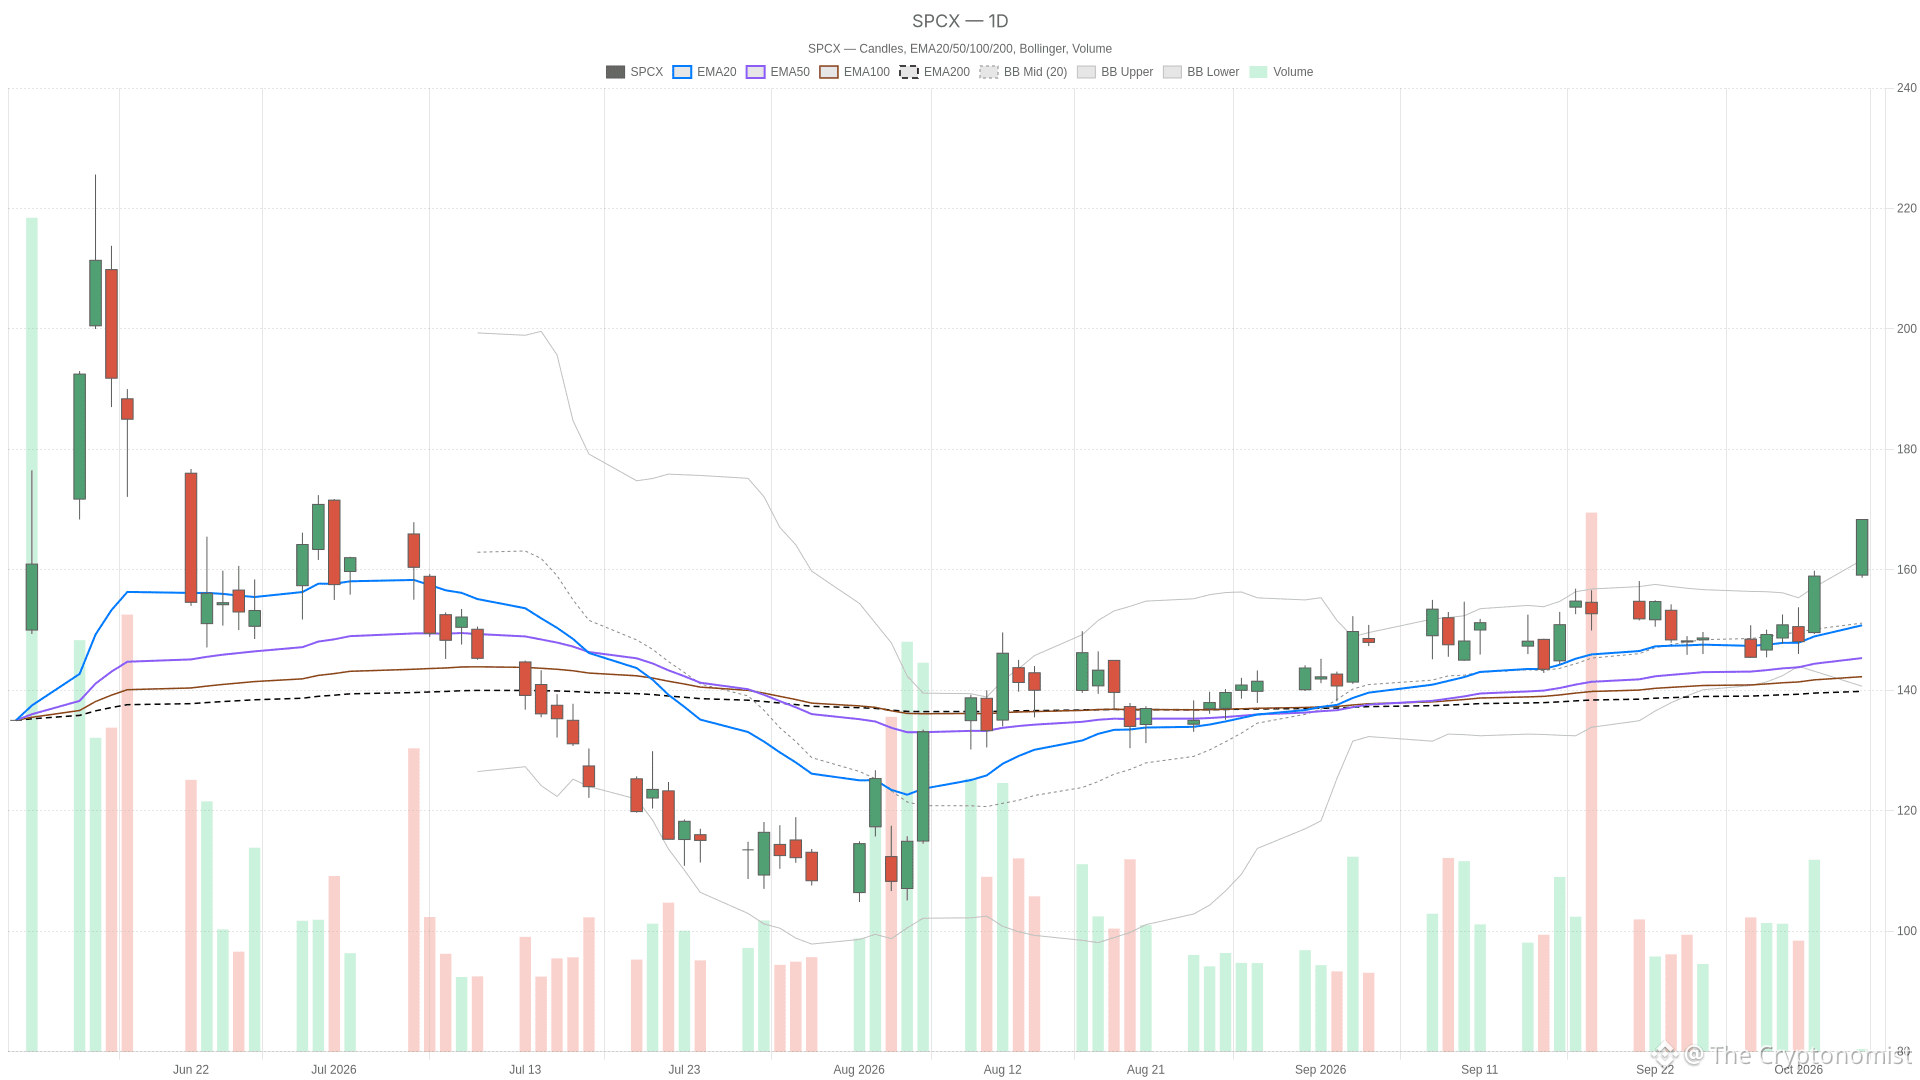 SPCX — daily chart with candlesticks, EMA20/EMA50 and volume.
Key takeaways
SpaceX (SPCX) was trading at $168.35 as of 11:06 ET on Monday, up 5.91% from the previous close of $158.96 on October 2.
Daily RSI14 stands at 67.51, below the overbought threshold of 70, while the daily MACD histogram is at 0.96, up from -0.03 on the prior candle.
Hourly RSI14 is at 79.88 and 15-minute RSI14 is at 84, both in overbought territory.
Price trades above the daily upper Bollinger band at $161.64, the hourly upper band at $166.12, and the daily pivot at $156.05.
The next hourly resistance (R1) sits at $170.50; daily support (S1) is at $152.25.
SpaceX Daily Chart: MACD Histogram at 0.96, RSI14 at 67.51
On the daily chart, the structure behind SpaceX stock has shifted clearly higher. The 20-session EMA sits at $150.81, up from $148.96 on the prior candle. Price trades well above both the 20-session average and the 50-session EMA at $147.21. Daily RSI14 has risen to 67.51 from 61.48, which keeps it below the overbought threshold of 70 but close to it.
The daily MACD line is at 3.85 against a signal of 2.89, a positive combination. The histogram has moved to 0.96 from -0.03, marking a bullish cross. The histogram now sits above zero after being below it on the previous candle.
The daily Bollinger setup shows a mid-band at $151.15, an upper band at $161.64 and a lower band at $140.66. The intraday price is running above the upper band. Daily ATR14 is at 7.04, up from 6.83. The daily pivot for the current session, based on the October 2 candle, stands at $156.05. Resistance (R1) is at $162.75 and support (S1) at $152.25. Price is trading above all three, meaning the prior resistance has already been cleared intraday.
Hourly Picture Confirms, With a Caveat
The hourly timeframe reinforces the daily bias. SPCX trades above its 20-hour EMA at $156.61. That average sits above the 50-hour EMA at $153.04 and the 200-hour EMA at $147.05, forming a fully stacked bullish alignment across all three averages.
However, hourly RSI14 has climbed to 79.88 from 79.09, placing it well inside overbought territory. The hourly MACD line reads 3.82 against a signal of 2.33, with the histogram at 1.49, up from 1.23. The reading is positive and confirms the directional push.
The hourly Bollinger bands show a mid-band of $155.00, an upper band of $166.12 and a lower band of $143.88. Price is trading above the upper band here as well. Hourly ATR14 has eased slightly to 2.49 from 2.54. The hourly pivot sits at $164.59, with resistance (R1) at $170.50 and support (S1) at $161.53. Price is above the pivot and below R1, meaning the next hourly level to clear is $170.50.
In short, the hourly chart confirms the daily uptrend but complicates it somewhat. The combination of an overbought RSI14 and a price already outside its upper band suggests the move is extended on this timeframe. The trend direction itself is not in question.
15-Minute Context: Execution Near Stretched Levels
On the 15-minute chart, used here only for timing, the picture is similarly stacked bullish. Price trades above the 20-period EMA at $162.18, which is above the 50-period EMA at $157.98 and the 200-period EMA at $153.11. RSI14 on this timeframe stands at 84, up from 83.01, deep into overbought territory. The MACD line is at 3.15 versus a signal of 2.46, with the histogram at 0.69.
The 15-minute Bollinger bands show a mid-band of $161.27, an upper band of $168.84 and a lower band of $153.70. Price is sitting just below that upper band. There is very little room left before the band itself would need to expand to accommodate further upside. The 15-minute pivot is at $167.32, with resistance (R1) at $168.07 and support (S1) at $166.91. Price is trading above R1, which has already been cleared on this timeframe.
News Flow Around SpaceX
A Seeking Alpha report published before Monday’s session noted that SPCX climbed 7% on Friday amid an AI satellite launch and the Crew-13 ISS mission.
Separately, a Yahoo Finance piece published Sunday compared SpaceX with Rocket Lab. It noted that SPCX closed at $158.96 on October 2 against Rocket Lab’s $73.92. The report observed that despite SpaceX being roughly forty times the size of Rocket Lab and neither company being profitable, the market charges a similar price for both.
A Motley Fool article published Sunday argued that SpaceX stock could close above $200 again before 2028. The stock has closed above that level only once. The view was tied to the possibility of a $10.4 billion quarter by the end of 2027. A separate Motley Fool piece published Saturday discussed the Starship program reaching orbit and argued its revenue-producing potential is too big to ignore. Meanwhile, a Yahoo Finance report published before Monday’s open flagged SpaceX’s upcoming earnings update. It described the update as a point worth watching for long-term investors, without disclosing specific figures.
Bullish Scenario
The bullish case for SpaceX stock rests on the daily trend remaining intact: EMA20 above EMA50, a positive MACD histogram, and RSI14 still below 70 despite the rally. For continuation, the stock would need to clear the 15-minute upper Bollinger band at $168.84, since price is currently just beneath it. On the longer timeframe, clearing the hourly resistance (R1) at $170.50, which sits just above the current price, would also support further upside. A sustained move through both levels, with the hourly and daily RSI14 readings holding below 80 and 70 respectively rather than rolling over, would keep the structure aligned across all three timeframes.
Bearish Scenario
On the other hand, the overbought readings on the hourly (79.88) and 15-minute (84) RSI14 leave room for a pullback even within an intact daily uptrend. The 15-minute pivot at $167.32 is a level to watch on the way down, followed by the 15-minute support (S1) at $166.91. A break below the hourly pivot at $164.59 would be a more meaningful signal, since it would put price back inside the hourly Bollinger band rather than above it. Further down, the daily resistance (R1) at $162.75 and the daily upper Bollinger band at $161.64 mark the zone where the current advance would need to hold. A slip back toward the daily pivot at $156.05 would materially weaken the bullish case built on this session’s gain.
Where SpaceX Stock Stands Now
Overall, SpaceX stock is trading at $168.35 as of 11:06 ET, up 5.91% versus Friday’s close of $158.96. The daily, hourly and 15-minute trends all point in the same direction. The daily picture shows a bullish MACD cross and the EMA20 above the EMA50, while the hourly chart confirms the trend with a fully stacked EMA alignment.
At the same time, RSI14 readings on both the hourly (79.88) and 15-minute (84) charts are deep into overbought territory. Price is trading above the upper Bollinger band on the daily and hourly timeframes, and just below it on the 15-minute chart. Daily ATR14 is at 7.04, up from 6.83. What remains uncertain is whether the next move is a continuation toward the hourly resistance (R1) at $170.50 or a pullback toward the hourly pivot at $164.59 and the daily resistance (R1) at $162.75. Those levels would test whether Monday’s advance has staying power.
FAQ
What is the current trend for SpaceX stock?
SpaceX stock shows a bullish daily trend. The 20-session EMA at $150.81 sits above the 50-session EMA at $147.21, the daily MACD histogram is positive at 0.96, and price at $168.35 trades above all key short-term moving averages.
Is SpaceX stock overbought right now?
On the daily timeframe, RSI14 at 67.51 remains below the 70 overbought threshold. However, hourly RSI14 is at 79.88 and 15-minute RSI14 is at 84, both in overbought territory. Price is also trading above the upper Bollinger band on the daily and hourly charts, and just below it on the 15-minute chart.
What are the key levels to watch for SpaceX stock?
On the upside, hourly resistance (R1) at $170.50 is the next level to clear. On the downside, the hourly pivot at $164.59 and the daily resistance (R1) at $162.75 are the first levels that would test the durability of Monday’s advance.
What news is affecting SpaceX stock?
Recent coverage includes a Seeking Alpha report noting SPCX climbed 7% on Friday, a Yahoo Finance comparison with Rocket Lab published Sunday, and a Yahoo Finance report published before Monday’s open flagging SpaceX’s upcoming earnings update.
Disclaimer: This article is for informational purposes only and does not constitute financial advice, an investment recommendation, or a solicitation to buy or sell any financial instrument. The analysis provided is not indicative of future results. Investing in financial markets carries a high risk of capital loss. Always do your own research (DYOR) and consult a qualified financial advisor before making any decision.
Cryptonomist and the author hold no positions in the financial instruments mentioned and receive no compensation from the companies covered.
Article produced with the assistance of artificial intelligence and reviewed by the editorial team.