

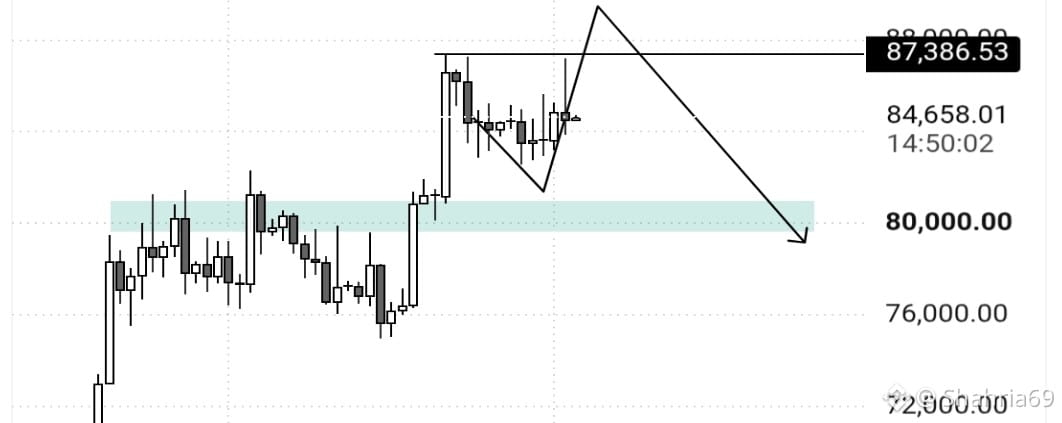

Bitcoin (BTC/USDT) Daily Chart Analysis: Recent Market Outlook
Based on a daily (1D) chart analysis of Bitcoin and Tether (BTC/USDT) from the popular charting platform TradingView, a price movement forecast has been published. Created by mark__trader on October 3, 2026, this chart outlines the current market conditions and future trajectory.
Current Market Status
Asset & Timeframe: Bitcoin / Tether (BTC/USDT), 1-day (1D) chart.
Platform: Binance exchange.
Current Price: $84,658.01 USD, showing a positive trend with an increase of $139.99 (+0.17%).
Key Technical Levels
Resistance Level: A major resistance level is marked at $87,386.53 on the chart.
Support Zone: A crucial support region is located around $80,000.00.
Lower Support: Another strong support level is visible further down at $67,345.66.
Market Prediction Outline
According to the technical drawing, Bitcoin's price is expected to move slightly upward from its current level to test the upper resistance zone. Following this, a downward correction may occur, bringing the price back down toward the $80,000 support zone.
Disclaimer: The cryptocurrency market is highly volatile. Any trading or investment decisions should be preceded by independent technical analysis and proper risk management.